起因
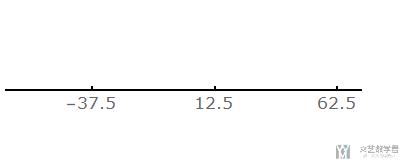
写文档的时候想画个图,手头没什么工具,就想着使用mathematica来画一个吧。我是想实现下面这种图像:

实现方法
最开始想到了使用Plot这个函数来实现,画出x=0的图像,然后把坐标轴画出来:
- pt1 = Plot[0, {x, -70, 70},
- Axes -> {True, False}, AxesStyle -> Thick,
- Ticks -> {{-37.5, 12.5, 62.5}}, TicksStyle -> Directive["Label", 17]
- ];
- text1 = Graphics[{Text[Style["1号量化器", Italic, 20], {0, 0.1}]}];
- Show[pt1, text1, PlotRange -> {{-70, 70}, {0, 0.7}}]
于是我们得到了下面的这种图像:

注意:下面的方法比较好!
但是上面的方法有很多不方便的地方,特别要同时画多个的时候,最后还是使用了Graphics来实现的:
- CoordinateFunc[h_, x0_, x1_, x2_, start_, end_] :=
- Module[{width0 = (end - start)/100, width1 = (end - start)/20},
- (*h是y轴,x0,x1,x2分别是坐标上三个点*)
- Graphics[{{Thick, Line[{{start, h}, {end, h}}]},
- {Thick, Line[{{x0, h}, {x0, width0 + h}}]},
- Text[Style[ToString[x0], 17], {x0, h - width1}],
- {Thick, Line[{{x1, h}, {x1, width0 + h}}]},
- Text[Style[ToString[x1], 17], {x1, h - width1}],
- {Thick, Line[{{x2, h}, {x2, width0 + h}}]},
- Text[Style[ToString[x2], 17], {x2, h - width1}]}]
- ]
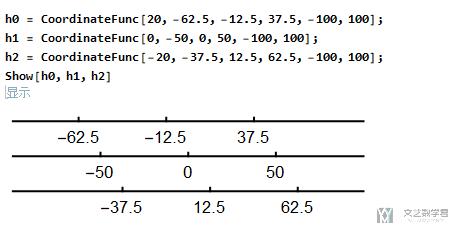
这样我们就可以同时画出多个横轴来:
- h0 = CoordinateFunc[20, -62.5, -12.5, 37.5, -100, 100];
- h1 = CoordinateFunc[0, -50, 0, 50, -100, 100];
- h2 = CoordinateFunc[-20, -37.5, 12.5, 62.5, -100, 100];
- Show[h0, h1, h2]

如果要加上文字说明,也是可以接着在旁边进行添加的:
- h0 = CoordinateFunc[30, -62.5, -12.5, 37.5, -100, 100];
- h1 = CoordinateFunc[0, -50, 0, 50, -100, 100];
- h2 = CoordinateFunc[-30, -37.5, 12.5, 62.5, -100, 100];
- text0 = Graphics[{Text[Style["0号量化器", Italic, 14], {125, 30}]}];
- text1 = Graphics[{Text[Style["1号量化器", Italic, 14], {125, -30}]}];
- Show[h0, h1, h2, text0, text1]

- 微信公众号
- 关注微信公众号
-

- QQ群
- 我们的QQ群号
-


评论