这一篇文章我们会讲一下如何在Mathematica中绘制三维投影。这个功能还是很好用的,基本就是使用下面的一命令就可以完成。
P /. Graphics3D[gr_, opts___] :>
  Graphics3D[{gr,
    Scale[gr, #, {-600, 500, -500}] & /@ (1 + 10^-3 -
       IdentityMatrix[3])}, PlotRange -> All, opts]
其中P是我们要转换的图像, {-600, 500, -500}是指我们投影的x,y,z的座标。比如我们投影到下面那个面,可以写成x=0.
下面我们看三个例子。
具体例子
Plot3D[Sin[x y], {x, 0, 3}, {y, 0, 3}, Mesh -> None,
  PlotRange -> All] /.
 Graphics3D[gr_, opts___] :>
  Graphics3D[{gr,  Scale[gr, #, {-1, -1, -1}] & /@ (1 + 10^-3 - IdentityMatrix[3])},
   PlotRange -> All, opts]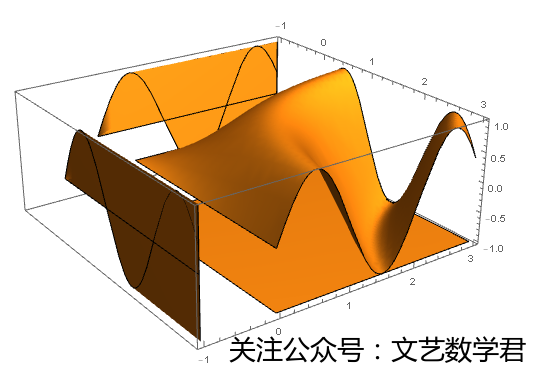
这里选择{-1,-1,-1}是指投影到的地方为x=-1,y=-1,z=-1
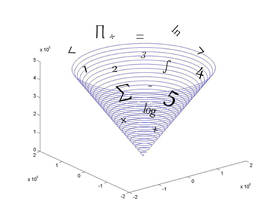
c = ParametricPlot3D[{t Cos[t], t Sin[t], 1.5 t}, {t, 0, 8 \[Pi]},
   PlotStyle -> {Red, Tube[0.15]}, MaxRecursion -> 1, Axes -> None];
proj = c /.  Graphics3D[gr_, opts___] :>
   Graphics3D[{gr,
     Scale[gr, #, {-8 Pi, -8 Pi, -Pi}] & /@ (1 + 10^-3 -
        IdentityMatrix[3])}, PlotRange -> All, opts]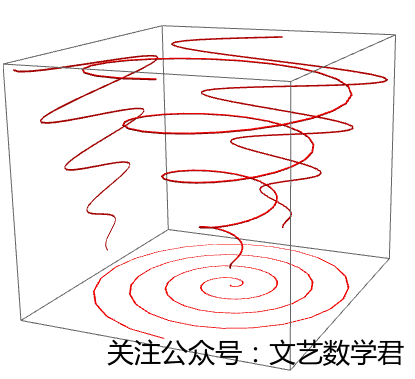
这里是三维空间上曲线的投影。
c = ParametricPlot3D[{{4 + (3 + Cos[v]) Sin[u],
     4 + (3 + Cos[v]) Cos[u], 4 + Sin[v]}, {8 + (3 + Cos[v]) Cos[u],
     3 + Sin[v], 4 + (3 + Cos[v]) Sin[u]}}, {u, 0, 2 Pi}, {v, 0,
    2 Pi}, PlotTheme -> "Business", Mesh -> None,
   BoundaryStyle -> Opacity[0]];
c /. Graphics3D[gr_, opts___] :>   Graphics3D[{gr,
    Scale[gr, #, {-2 Pi, -2 Pi, -Pi}] & /@ (1 + 10^-3 -
IdentityMatrix[3])}, PlotRange -> All, opts] 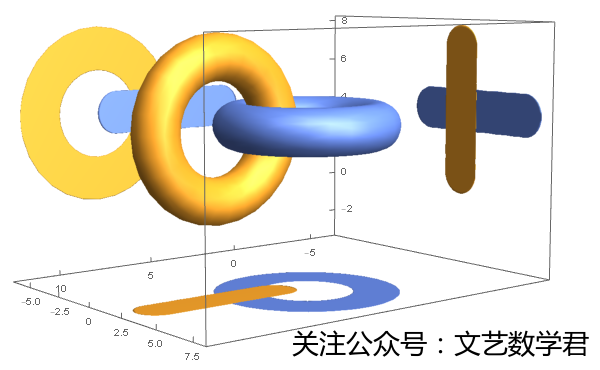
这个是两个相交的圆环的投影,关于圆环的内容,可以看一下文章如果地球是圆环
参考资料
参考了百度贴吧里的一篇文章:
- 微信公众号
- 关注微信公众号
-

- QQ群
- 我们的QQ群号
-


评论