文章目录(Table of Contents)
简介
本文我们会聚焦在 LaTeX 中的一个 package,即 Tikz。
【注意】目前如果画图,自己用下来还是使用 PPT 比较方便,可以参考下面的链接,Visio 和 PowerPoint 绘图常见操作记录。目前还是 PPT 绘图用的比较多。
参考资料
Tikz 基础知识(一个 20 min 的视频,可以快速上手),How to make beautiful math graphics using Tikz & LaTeX;
利用 Tikz 绘制神经网络,Drawing Neural Networks in TikZ: Short Guide
Tikz 绘制基础形状
导入 package
在开始使用 Tikz 之前,我们首先导入对应的 package。这里我们还导入关于数学公式相关的 package,通常我们会在图中包含公式:
- % 绘图
- \usepackage{tikz}
- \usetikzlibrary{matrix, positioning, fit}
- % 数学公式
- \usepackage{amsmath}
- \usepackage{amsfonts}
绘制折线
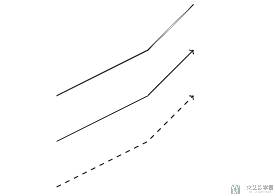
首先我们看一下如何绘制折线。下面分别绘制三种折线,分别是,普通折线,带有箭头的折线,带有箭头+虚线的折线:
- \begin{tikzpicture}
- \draw (0,0) -- (2,1) -- (3,2);
- \draw[->] (0,-1) -- (2,0) -- (3,1); % 带箭头
- \draw[->, dashed] (0,-2) -- (2,-1) -- (3,0); % 带箭头+虚线
- \end{tikzpicture}
我们看一下上面的例子,可以看到:
- 绘制的内容在
tikzpicture中; - 通过指定坐标进行绘制,这里坐标是在这个这个图像内相对和,图像之间相互不影响;
- 使用
draw作为关键词,draw后面可以加上不同的样式,例如虚线。折线使用--连接坐标即可;
于是上面的代码最终绘制的结果如下所示:
绘制圆与椭圆
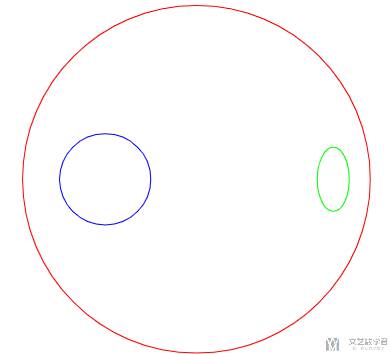
接下来我们查看绘制圆的例子。还是使用 draw 作为关键词。与上面折线相比,将 -- 换为关键词 circle 或是 ellipse 即可。后面分别加上圆的半径即可。
同样我们可以在 draw 中设置不同的颜色,且圆的半径可以使用不同的单位。
- \begin{tikzpicture}
- \draw[blue] (0,0) circle (1);
- \draw[red] (2,0) circle (1.5in);
- \draw[green] (5,0) ellipse (10pt and 20pt);
- \end{tikzpicture}
运行上面的代码,最终的结果如下所示:
绘制长方形
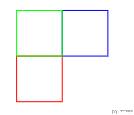
我们将 circle 换为 rectangle 即可进行矩形的绘制。例如在下面的例子中分别绘制了三个矩阵。这里我们定义矩阵的「左下角点」+「右上角点」:
- \begin{tikzpicture}
- \draw[red] (0,0) rectangle (1,1);
- \draw[blue] (1,1) rectangle (2,2);
- \draw[green] (1,1) rectangle (0,2);
- \end{tikzpicture}
最终绘制的结果如下图所示(可以通过矩形的颜色与上面代码对应上):
绘制 Grid
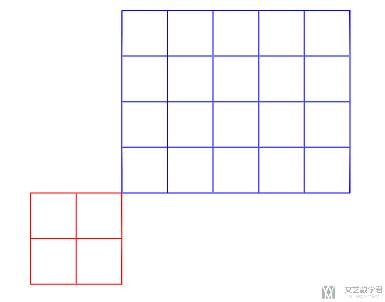
我们将 rectangle 换为 grid 即可绘制网格。例如下面的例子中,我们分别绘制一个 54 的网格和一个 22 的网格:
- \begin{tikzpicture}
- \draw[blue] (0,0) grid (5,4);
- \draw[red] (0,0) grid (-2,-2);
- \end{tikzpicture}
最终的结果如下图所示:
Tikz 样式设置
修改图像整体大小
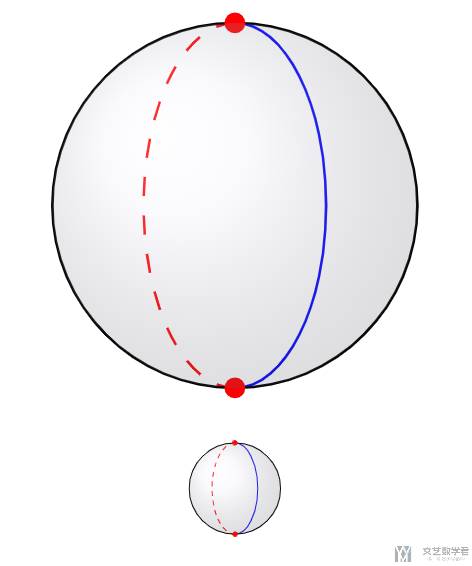
有的时候我们需要整体修改图像的大小,这个时候时候可以使用 transform canvas={scale=4.0},scale 后面是缩放的倍数。下面是完整的代码,我们将要绘制的图像放在 center 中使其保持居中:
- \begin{center}
- \begin{tikzpicture}[transform canvas={scale=4.0}] % transform 粗细也一起变化
- \draw[blue] (0,1) arc (90:-90:0.5cm and 1cm); % 蓝色的线
- \draw[dashed, red] (0,1) arc (90:270:0.5cm and 1cm); % 红色虚线
- \draw (0,0) circle (1cm); % 黑色圆
- \filldraw[red] (0,1) circle (0.05); % 带有填充, 上下红点
- \filldraw[red] (0,-1) circle (0.05);
- \shade[ball color=blue!10!white,opacity=0.20] (0,0) circle (1cm); % 与 fill 不同, shade 可以有阴影
- \end{tikzpicture}
- \end{center}
我们分别调整为 scale=1 和 scale=4,最终的结果如下图所示,可以看到一大一小两个球体:
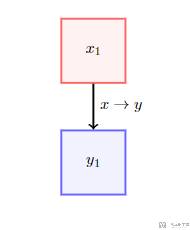
自定义样式
我们也可以提前自定义好一些样式,从而方便使用。下面的例子中,我们定义了两种样式,包含不同的边框颜色和不同的填充颜色。这里 red!60 中的 60 表示 red 与 white 的比例,60% 的 red,40% 的 white。也就是数字越小,颜色越淡。
接着利用好定义的两个样式首先绘制两个 node,接着将这两个 node 连接起来。简单说明一下 node 和 line 的语句:
\node[样式ID] (node ID) [方位] {文字内容};- 关于方位包含,
[left, right, above, below] - 可以指定距离,
[left=0.01 of NodeID],也可以不指定距离,[left=of NodeID]
- 关于方位包含,
\draw[样式] (node ID.位置) to node[auto] {文字内容} (node ID.位置);
- \begin{tikzpicture}[
- node1/.style={rectangle, draw=red!60, fill=red!5, very thick, minimum size=40},
- node2/.style={rectangle, draw=blue!60, fill=blue!5, very thick, minimum size=40},
- ]
- %Nodes
- \node[node1] (nodeID1) {$x_{1}$};
- \node[node2] (nodeID2) [below=of nodeID1] {$y_{1}$};
- % Line
- \draw[->, very thick] (nodeID1.south) to node[auto] {$x \rightarrow y$} (nodeID2.north);
- \end{tikzpicture}
最终的结果如下图所示,两个 node 的填充颜色和边框颜色不同:
Tikz 结合 Node 添加说明
我觉得,Tikz 厉害的地方在于可以结合 node 在图片的任意位置添加任意注释说明等(这里的说明可以是任意的格式,文字,图片,甚至是一个 tikz picture)。
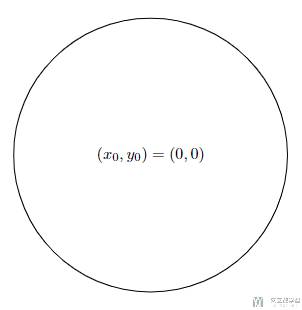
在指定位置写入文字
首先我们来看一个基本的用法,可以将 node 放在指定坐标,然后添加文字。下面的例子中,我们首先绘制一个圆,接着在圆心的位置写下文字:
- \begin{tikzpicture}
- \draw (0,0) circle (3); % 绘制圆
- \draw node at (0,0) {$(x_{0},y_{0})=(0,0)$}; % 圆心位置写入内容
- \end{tikzpicture}
最终的效果如下图所示:
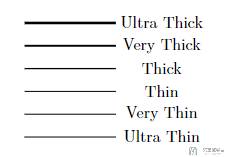
利用多个 Node 写入文字
在上面的例子中,我们利用一个 node 从而在一处添加了文字。这个方式很容易进行扩展,可以在多处进行文字的添加。例如下面的例子中,我们绘制出不同粗细的线条,接着每个线条的后方添加文字:
- \begin{tikzpicture}
- % 绘制折线
- \draw[ultra thick] (0,3) -- (2,3);
- \draw[very thick] (0,2.5) -- (2,2.5);
- \draw[thick] (0,2) -- (2,2);
- \draw[thin] (0,1.5) -- (2,1.5);
- \draw[very thin] (0,1) -- (2,1);
- \draw[ultra thin] (0,.5) -- (2,.5);
- % 使用 node, 在指定位置显示文字
- \draw node at (3, 3) {Ultra Thick};
- \draw node at (3, 2.5) {Very Thick};
- \draw node at (3, 2) {Thick};
- \draw node at (3, 1.5) {Thin};
- \draw node at (3, 1) {Very Thin };
- \draw node at (3, 0.5) {Ultra Thin};
- \end{tikzpicture}
最终的效果如下图所示,每个线条后方都有对应的文字:
调整 Node 文字位置
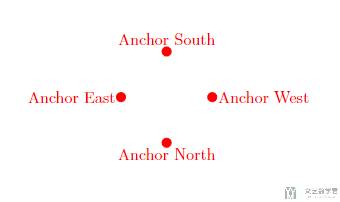
在这个例子中,我们通过 anchor=west 等其他方位将 node 的文字固定在不同的位置。我们分别在四个坐标绘制四个圆,接着在不同的位置借助 node 加入文字描述:
- \begin{tikzpicture}
- \filldraw[red] (1,0) circle (0.1cm) node[anchor=west]{Anchor West};
- \filldraw[red] (-1,0) circle (0.1cm) node[anchor=east]{Anchor East};
- \filldraw[red] (0,1) circle (0.1cm) node[anchor=south]{Anchor South};
- \filldraw[red] (0,-1) circle (0.1cm) node[anchor=north]{Anchor North};
- \end{tikzpicture}
最终的效果如下所示,可以看到文字出现在圆的不同位置:
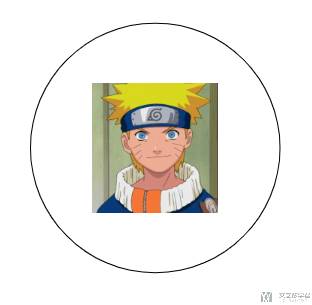
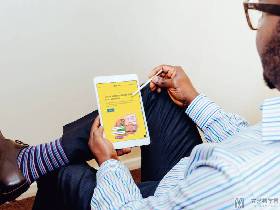
利用 Node 插入图片
除了插入文字信息之外,我们还可以插入图片。例如下面的例子,我们在圆心的位置插入图片:
- \begin{tikzpicture}
- \node[inner sep=0pt] (Naruto) at (0,0)
- {\includegraphics[width=.25\textwidth]{./images/test.png}};
- % 绘制圆
- \draw (0,0) circle (3);
- \end{tikzpicture}
最终的效果如下所示,可以看到圆心出会有图片:
参考资料,How can I embed an external image within a tikzpicture environment?
Tikz 绘制矩阵
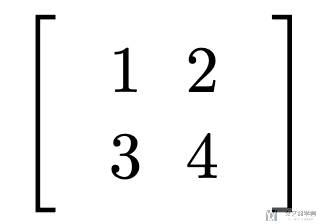
简单矩阵绘制
使用 Tikz 进行简单矩阵绘制:
- \begin{tikzpicture}
- \matrix (m) [
- matrix of math nodes,
- left delimiter={[},
- right delimiter={]}
- ]{
- 1 & 2 \\
- 3 & 4 \\
- };
- \end{tikzpicture}
对上面的内容说明:
matrix of math nodes表示用数学公式排版;- 每一行用
\\结束,每列用&分隔。 left delimiter={[}和right delimiter={]}表示加上中括号,像矩阵一样;- 可换成
{( )}、{| |}等。
最终的绘制结果如下图所示:
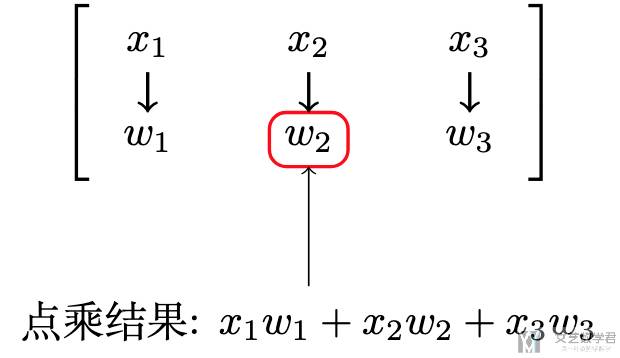
矩阵结合高亮和注释
有的时候需要使用 Tikz 对矩阵中的元素进行高亮,或是加上一些文字的注释。下面给出一个例子。
- \begin{tikzpicture}
- \matrix (m) [
- matrix of math nodes,
- nodes in empty cells,
- row sep=1em, column sep=2em,
- left delimiter={[}, right delimiter={]}
- ]{
- x_1 & x_2 & x_3 \\
- w_1 & w_2 & w_3 \\
- };
- % 高亮
- \draw[red, thick, rounded corners]
- (m-2-2.north west) rectangle (m-2-2.south east);
- % 箭头:每列对齐
- \foreach \i in {1,2,3} {
- \draw[->, thick] (m-1-\i.south) -- (m-2-\i.north);
- }
- % 注释
- \node[below=1cm of m-2-2] (dot) {点乘结果: $x_1 w_1 + x_2 w_2 + x_3 w_3$};
- \draw[->] (dot.north) -- (m-2-2.south);
- \end{tikzpicture}
对上面的代码进行一些简单的说明:
m-2-2表示第 2 行第 2 列,可以换成m-1-3代表第 1 行第 3 列;- 用
node[below=1cm of m-2-2]添加说明; draw[->]表示绘制的箭头的方向;
最后绘制出来的结果如下所示:
Tikz 综合使用
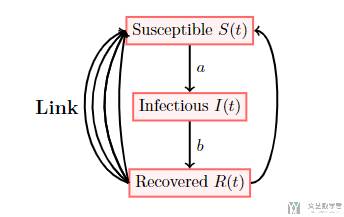
使用曲线连接 node
在这个例子中,我们会介绍如何使用「曲线」来连接两个 node。在下面的代码中,首先:
- 定义了两种 style,一种是
node的样式,另外一种为字体; - 接着定义了三个
node。其实node可以是任意的形状,图片,甚至是tikz的图像; - 最后将
node连接起来即可。这里我们尝试使用曲线进行连接:- Control 点:
\draw[->, very thick] (Recovered.east) .. controls +(right:7mm) and +(right:7mm) .. (Susceptible.east); - 角度:
\draw[bend left=70, ->, very thick] (Recovered.west) to node[legend,auto] {Link} (Susceptible.west);
- Control 点:
- \begin{tikzpicture}[
- SIR/.style={rectangle, draw=red!60, fill=red!5, very thick, minimum size=5mm},
- legend/.style={font=\large\bfseries},
- ] % 定义 style, red!5 表示 5% red
- % Nodes
- \node[SIR] (Susceptible) {Susceptible $S(t)$};
- \node[SIR] (Infectious) [below=of Susceptible] {Infectious $I(t)$};
- \node[SIR] (Recovered) [below=of Infectious] {Recovered $R(t)$};
- % Lines
- \draw[->, very thick] (Susceptible.south) to node[right] {$a$} (Infectious.north); % node 可以添加字符 () to () 是最简单的写法
- \draw[->, very thick] (Infectious.south) to node[right] {$b$} (Recovered.north);
- % 弧线
- \draw[->, very thick] (Recovered.east) .. controls +(right:7mm) and +(right:7mm) .. (Susceptible.east); % control 点
- \draw[bend left, ->, very thick] (Recovered.west) to (Susceptible.west);
- \draw[bend left=10, ->, very thick] (Recovered.west) to (Susceptible.west);
- \draw[bend left=30, ->, very thick] (Recovered.west) to (Susceptible.west);
- \draw[bend left=50, ->, very thick] (Recovered.west) to (Susceptible.west);
- \draw[bend left=70, ->, very thick] (Recovered.west) to node[legend,auto] {Link} (Susceptible.west);
- \end{tikzpicture}
编译上面的代码,最终获得如下的效果图:
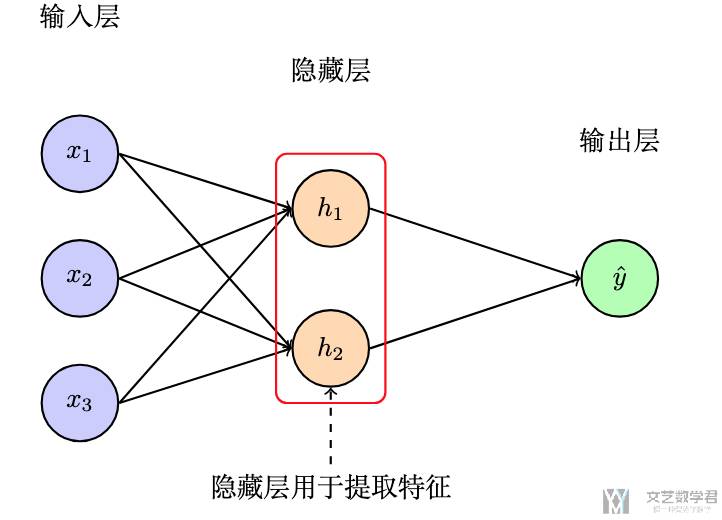
绘制简易的全连接网络
下面结合 node 的定义,node 的连接,高亮的知识点,来绘制一个简易的全连接网络。在代码中包含注释。只有一个需要注意,在 matrix of nodes 环境中,矩阵的每个元素默认是一个 node,所以可以用 |[style]| content 的形式来为某个矩阵单元(也就是一个节点)单独指定样式。
- \begin{tikzpicture}[
- % 样式定义
- neuron/.style={circle, draw=black, thick, minimum size=1cm},
- input/.style={neuron, fill=blue!20},
- hidden/.style={neuron, fill=orange!30},
- output/.style={neuron, fill=green!30},
- conn/.style={->, thick},
- annot/.style={text width=4em, align=center}
- ]
- % 输入层
- \matrix (inputLayer) [
- matrix of nodes, nodes={input},
- column sep=1cm, row sep=0.6cm
- ]{
- |[input]| $x_1$ \\
- |[input]| $x_2$ \\
- |[input]| $x_3$ \\
- };
- % 隐藏层
- \matrix (hiddenLayer) [
- matrix of nodes, nodes={hidden},
- column sep=1cm, row sep=0.8cm,
- right=2cm of inputLayer
- ] {
- |[hidden]| $h_1$ \\
- |[hidden]| $h_2$ \\
- };
- % 输出层
- \matrix (outputLayer) [
- matrix of nodes, nodes={output},
- column sep=1cm, row sep=1cm,
- right=2.5cm of hiddenLayer
- ] {
- |[output]| $\hat{y}$ \\
- };
- % 连接:输入到隐藏
- \foreach \i in {1,2,3}
- \foreach \j in {1,2}
- \draw[conn] (inputLayer-\i-1.east) -- (hiddenLayer-\j-1.west);
- % 连接:隐藏到输出
- \foreach \i in {1,2}
- \draw[conn] (hiddenLayer-\i-1.east) -- (outputLayer-1-1.west);
- % 标签说明
- \node[annot, above=of inputLayer-1-1] {输入层};
- \node[annot, above=of hiddenLayer-1-1] {隐藏层};
- \node[annot, above=of outputLayer-1-1] {输出层};
- % 高亮隐藏层
- \node[
- draw=red, thick, rounded corners,
- fit=(hiddenLayer-1-1)(hiddenLayer-2-1),
- inner sep=0.2cm
- ] {};
- % 注释箭头
- \node[below=1cm of hiddenLayer-2-1] (comment) {隐藏层用于提取特征};
- \draw[->, dashed, thick] (comment.north) -- (hiddenLayer-2-1.south);
- \end{tikzpicture}
最终上面的图像编译之后如下所示:
- 微信公众号
- 关注微信公众号
-

- QQ群
- 我们的QQ群号
-


评论