文章目录(Table of Contents)
简介
在前面的内容中,我们完成了路网的搭建,车辆的生成,也了解了信号灯控制的相关内容。现在我们希望可以获得一些监测的数据。这个时候我们就可以通过设置 detector(探测器) 来完成检测。主要有detector(探测器),分别是:
- Simulation/Output/Induction Loops Detectors (E1),断面;
- Simulation/Output/Lanearea Detectors (E2),区域(类似于摄像头);
- Simulation/Output/Multi-Entry-Exit Detectors (E3),带有起点和终点;
下面对于上面的三个detector(探测器)来分别进行说明。关于这部分环境的代码,可以在 Github 仓库中找到,SUMO Tutorial, Detector。
SUMO E1 Detector 介绍
生成 E1 Detector
E1 Detector 是 Loops Detectors。我们可以通过一个 additional file 来定义一个 E1 的探测器:
- <additional>
- <inductionLoop id="<ID>" lane="<LANE_ID>" pos="<POSITION_ON_LANE>" freq="<AGGREGATION_TIME>"
- file="<OUTPUT_FILE>" friendlyPos="true"/>
- </additional>
上面的参数分别如下:
- The
“id”is any string by which you can name the detector. - The attributes
“lane”and“pos”describe on which lane and at which position on this lane the detector is placed. (指定在哪一个车道,哪一个位置设置探测器) - The
“freq”-attribute describes the period over which collected values shall be aggregated.(探测器检测的频率) - The
“file”attribute tells the simulation to which file the detector shall write his results into.
如果我们已经定义好了 network,我们也可以使用下面的命令来生成对应 additional 文件。自动生成的位置是会在红绿灯的路口的每一个 lane 处生成对应的 detector:
- python tools\output\generateTLSE1Detectors.py -n .net.net.xml -o e1.add.xml
输出的文件格式大致如下所示:
- <additional xmlns:xsi="http://www.w3.org/2001/XMLSchema-instance" xsi:noNamespaceSchemaLocation="http://sumo.dlr.de/xsd/additional_file.xsd">
- <e1Detector file="e1output.xml" freq="60" friendlyPos="x" id="e1det_edge11_2_0" lane="edge11_2_0" pos="79.10000000000001"/>
- <e1Detector file="e1output.xml" freq="60" friendlyPos="x" id="e1det_edge11_2_1" lane="edge11_2_1" pos="79.10000000000001"/>
- <e1Detector file="e1output.xml" freq="60" friendlyPos="x" id="e1det_edge16_0_0" lane="edge16_0_0" pos="79.10000000000001"/>
- <e1Detector file="e1output.xml" freq="60" friendlyPos="x" id="e1det_edge16_0_1" lane="edge16_0_1" pos="79.10000000000001"/>
- <e1Detector file="e1output.xml" freq="60" friendlyPos="x" id="e1det_edge4_0_0" lane="edge4_0_0" pos="79.10000000000001"/>
- <e1Detector file="e1output.xml" freq="60" friendlyPos="x" id="e1det_edge4_0_1" lane="edge4_0_1" pos="79.10000000000001"/>
- <e1Detector file="e1output.xml" freq="60" friendlyPos="x" id="e1det_edge9_3_0" lane="edge9_3_0" pos="79.10000000000001"/>
- <e1Detector file="e1output.xml" freq="60" friendlyPos="x" id="e1det_edge9_3_1" lane="edge9_3_1" pos="79.10000000000001"/>
- <e1Detector file="e1output.xml" freq="60" friendlyPos="x" id="e1det_edge22_1_1" lane="edge22_1_1" pos="79.10000000000001"/>
- </additional>
接着我们需要将生成的 additional 文件加到 .sumocfg 文件中去,如下所示:
- <configuration>
- <input>
- <net-file value="cross.net.xml"/>
- <route-files value="cross.rou.xml"/>
- <additional-files value="e1.add.xml"/>
- </input>
- <time>
- <begin value="0"/>
- <end value="10000"/>
- </time>
- </configuration>
除了上面在配置文件中进行修改之外,我们还可以直接在运行 sumo 的时候加上参数,-a,如下所示:
- sumo-gui -n .\wj.net.xml.clean.xiaoqu.name.tl.default.net.xml -r .\episode_routes_normal.rou.xml -a .\detector.add.xml
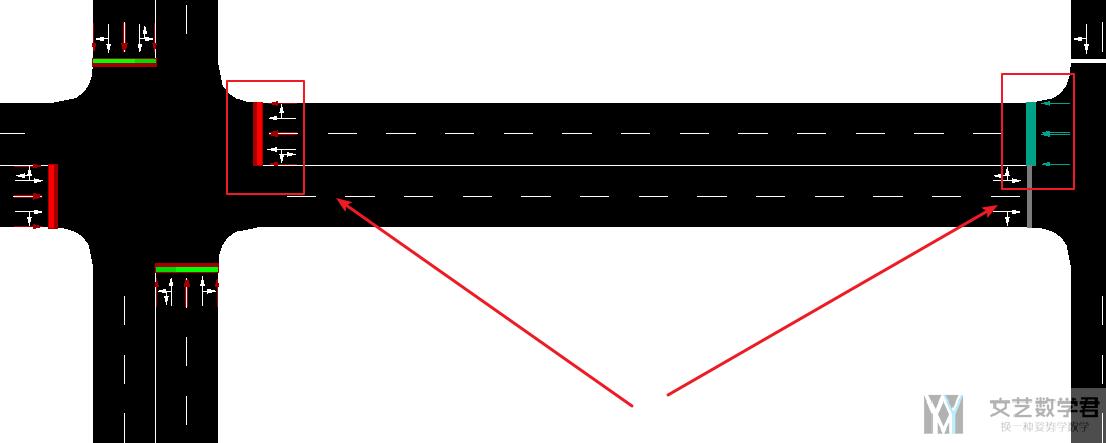
之后打开 sumo-gui 可以看到传感器所在的位置,和传感器的样子:

E1 Detector 的生成结果
E1 探测器的生成结果如下所示:
- <interval begin="1200.00" end="1260.00" id="e1det_edge4_0_0" nVehContrib="4" flow="240.00" occupancy="10.99" speed="5.70" harmonicMeanSpeed="5.02" length="5.00" nVehEntered="5"/>
对上面的参数逐一进行解释:
- begin, The first time step the values were collected in (本采集周期的开始时间)
- end, The last time step + DELTA_T the values were collected in (本采集周期的结束时间)
- id, The id of the detector (传感器的ID)
- nVehContrib, The number of vehicles that have completely passed the detector within the interval (一个周期内完整通过传感器的数量)
flow, The number of contributing vehicles extrapolated to an hour (每小时通过传感器的车流量,和上面的区别在于这个转换为小时的车流量)- occupancy, The percentage (0-100%) of the time a vehicle was at the detector.( 时间占有率,车辆通过的累计值与时间周期的比值)
speed, The arithmetic mean of the velocities of all completely collected vehicles (-1 indicates that no vehicles were collected). This gives the time mean speed. (平均速度)- harmonicMeanSpeed, The harmonic mean of the velocities of all completely collected vehicles (-1 indicates that no vehicles were collected). This gives the space mean speed. (调和平均速度)
- length, The mean length of all completely collected vehicles (-1 indicates that no vehicles were collected). (通过车辆的平均长度)
- nVehEntered, All vehicles that have touched the detector. Includes vehicles which have not passed the detector completely (and which do not contribute to collected values). (接触到传感器的车的数量)
SUMO E2 Detector 介绍
E2 Detector 又叫做 LaneAreaDetector。他的作用是来捕捉一片区域内的 traffic 的统计值。这个类似于现实中的「交通摄像头」的概念。E2 Detector 可以很好的获得一片区域内的拥堵情况(「排队长度」只能使用 E2 探测器获得):
生成 E2 Detector
E2 Detector 的定义的格式如下所示:
- <additional>
- <laneAreaDetector id="<ID>" lane="<LANE_ID>"
- pos="<START_POSITION_ON_LANE>" endPos="<END_POSITION_ON_LANE>" length="<DETECTOR_LENGTH>" // <- only two of those
- friendlyPos="<BOOL>" freq="<AGGREGATION_TIME>" file="<OUTPUT_FILE>"
- timeThreshold="<FLOAT>" speedThreshold="<FLOAT>" jamThreshold="<FLOAT>"
- tl="<TRAFFIC_LIGHT_ID>" to="<LANE_ID>"/>
- </additional>
下面大致解释一下上面的参数:
- pos, 探测器的起始位置;
- length, 探测器的探测的长度;
- speedThreshold, 车辆在什么速度下认为是停止的(
halt); - timeThreshold,车辆被识别为停止需要的时间(默认 1s 不运动)
- jamThreshold,和前车的距离最少为多少,此时识别为拥堵;
同样, 我们还是可以使用 generateTLSE2Detectors.py 来生成 E2 Detector。我们将生成的文件保存为 e2.add.xml。运行的命令为,python $SUMO_HOME/tools/output/generateTLSE2Detectors.py -n ./env/hello.net.xml -l 250 -d .1 -f 60。上面几个参数的含义是:
-l,表示探测器的长度;-d,表示探测器距离信号灯的距离;-f,表示探测器的频率;
输出文件大致如下:
- <additional xmlns:xsi="http://www.w3.org/2001/XMLSchema-instance" xsi:noNamespaceSchemaLocation="http://sumo.dlr.de/xsd/additional_file.xsd">
- <laneAreaDetector file="e2output.xml" freq="60" friendlyPos="x" id="e2det_edge11_2_0" lane="edge11_2_0" length="79.10000000000001" pos="0"/>
- <laneAreaDetector file="e2output.xml" freq="60" friendlyPos="x" id="e2det_edge11_2_1" lane="edge11_2_1" length="79.10000000000001" pos="0"/>
- <laneAreaDetector file="e2output.xml" freq="60" friendlyPos="x" id="e2det_edge16_0_0" lane="edge16_0_0" length="79.10000000000001" pos="0"/>
- <laneAreaDetector file="e2output.xml" freq="60" friendlyPos="x" id="e2det_edge16_0_1" lane="edge16_0_1" length="79.10000000000001" pos="0"/>
- <laneAreaDetector file="e2output.xml" freq="60" friendlyPos="x" id="e2det_edge4_0_0" lane="edge4_0_0" length="79.10000000000001" pos="0"/>
- <laneAreaDetector file="e2output.xml" freq="60" friendlyPos="x" id="e2det_edge4_0_1" lane="edge4_0_1" length="79.10000000000001" pos="0"/>
- <laneAreaDetector file="e2output.xml" freq="60" friendlyPos="x" id="e2det_edge9_3_0" lane="edge9_3_0" length="79.10000000000001" pos="0"/>
- <laneAreaDetector file="e2output.xml" freq="60" friendlyPos="x" id="e2det_edge9_3_1" lane="edge9_3_1" length="100" pos="0"/>
- </additional>
同样,我们把生成的 additional 文件加到 .sumocfg 文件中去。此时里面有 e1 和 e2 两种检测器:
- <configuration>
- <input>
- <net-file value="cross.net.xml"/>
- <route-files value="cross.rou.xml"/>
- <additional-files value="e1.add.xml, e2.add.xml"/>
- </input>
- <time>
- <begin value="0"/>
- <end value="10000"/>
- </time>
- </configuration>
现在打开 sumo-gui 可以看到传感器所在的位置(此时包含 e1 和 e2 探测器):

E2 Detector 的生成结果
E2 Detector 的每一行的输出如下所示:
- <interval begin="120.00" end="180.00" id="e2det_edge4_0_0" sampledSeconds="114.69" nVehEntered="10" nVehLeft="12" nVehSeen="13" meanSpeed="4.18" meanTimeLoss="7.90" meanOccupancy="11.65" maxOccupancy="30.23" meanMaxJamLengthInVehicles="0.92" meanMaxJamLengthInMeters="6.08" maxJamLengthInVehicles="4" maxJamLengthInMeters="27.52" jamLengthInVehiclesSum="55" jamLengthInMetersSum="365.07" meanHaltingDuration="24.00" maxHaltingDuration="40.00" haltingDurationSum="96.00" meanIntervalHaltingDuration="14.00" maxIntervalHaltingDuration="17.00" intervalHaltingDurationSum="56.00" startedHalts="1.00" meanVehicleNumber="2.07" maxVehicleNumber="5" />
对上面的属性简单说明一下:
- nVehEntered, The number of vehicles that entered the detector in the corresponding interval. (在这个时间范围内进入检测器范围的车辆, flow)
-
nVehLeft, The number of vehicles that left the detector in the corresponding interval. (在一定时间内离开探测器的车的数量)
-
nVehSeen, The number of vehicles that were on the detector in the corresponding interval (were "seen" by the detector).
- meanSpeed, The mean velocity over all collected data samples. (平均速度)
- meanTimeLoss, The average time loss per vehicle in the corresponding interval. The total time loss can be obtained by multiplying this value with nVehSeen. (每辆车的平均时间损失, 可以认为是延误, delay)
- maxJamLengthInVehicles, The length of the longest jam recognized during the interval duration. (最长的堵车的长度)
- jamLengthInVehiclesSum, The sum of all lengths of all jams recognized during the interval. In vehicles that have contributed to these jams. (所有堵车长度的和)
- startedHalts, The number of started halt (车辆启动停止的次数)
- meanHaltingDuration, The mean halting duration of vehicles that entered the area and are still inside or have left the area within the reported interval.
- meanIntervalHaltingDuration, The mean halting duration of vehicles that entered the area and are still inside or have left the area within the reported interval, counted from the interval's begin.
SUMO E3 Detector 介绍
E3 Detector 又称作 Multi-Entry-Exit Detectors。它相当于是多个探测器结合起来,统计一片新的区域的交通状态。E3 Detector是由一系列 detEntry 和 detExit 组成的。
生成 E3 Detector
E3 Detector 的定义的格式如下所示:
- <e3Detector id="e3_node10_edge11_2" freq="60" file="e3output.xml">
- <detEntry lane="edge11_2_0" pos="0.10"/>
- <detEntry lane="edge11_2_1" pos="0.10"/>
- <detExit lane="edge11_2_0" pos="-.1"/>
- <detExit lane="edge11_2_1" pos="-.1"/>
- </e3Detector>
这里一个探测器就不是一行数据,而是由多个位置的探测器组成的。在 E3 探测器设置的时候,可以设置参数 openEntry 为 true,这样当车辆只驶出没有驶入的时候不会有 warning,这个在岔路口的时候会比较有用。我们可以使用下面的命令来生成E3 Detector:
- python tools\output\generateTLSE3Detectors.py -n .net.net.xml -o detectors.add.xml
我们在 sumo-gui 看一下传感器所在的位置,可以看到出一条 edge 上两个 lane 上面有 4 个传感器,分别对应上面所定义的(两个 detEntry,两个 detExit)。这 4 个合起来是一个 E3 Detector:
E3 Detector 的生成结果
E3 Detector 的生成结果如下所示:
- <interval begin="300.00" end="360.00" id="e3_node10_edge4_0" meanTravelTime="31.37" meanOverlapTravelTime="32.05" meanSpeed="4.32" meanHaltsPerVehicle="0.75" meanTimeLoss="29.91" vehicleSum="12" meanSpeedWithin="5.09" meanHaltsPerVehicleWithin="1.00" meanDurationWithin="15.66" vehicleSumWithin="5" meanIntervalSpeedWithin="5.09" meanIntervalHaltsPerVehicleWithin="1.00" meanIntervalDurationWithin="15.66" meanTimeLossWithin="12.82"/>
我们挑几个属性来说明一下:
- meanTravelTime, The time vehicles needed to pass the area (the crossing of the vehicle front counts). Averaged over all vehicles which left the detector completely during the interval duration. (车辆通过该区域所需要的平均时间)
- meanSpeed, The mean speed of vehicles that have passed the area. Averaged over the interval and vehicles. (车辆通过该区域时的平均速度)
- meanHaltsPerVehicle, The number of halts of vehicles that have passed the area. Averaged over all vehicles that have left the detector during the interval duration. (通过这段区域的时候, 慢速车辆的数量)
- meanTimeLoss, The average time loss for all vehicles that have passed the area. (通过这片区域的时候, 平均时间损失. 相当于是 delay)
- vehicleSum, The number of vehicles that have left the area during the interval. (在一段时间内通过区域的车辆总数)
处理 Detector 的 output
现在我们有了不同探测器的输出, 我们想要对其进行处理. 下面给一个简单的例子, 使用xml.sax来处理数据. 关于xml.sax可以参考链接, python使用SAX解析xml
在python中使用 sax 方式处理 xml 要先引入xml.sax中的parse函数,还有xml.sax.handler中的ContentHandler.
ContentHandler 类方法介绍
SAX会在解析XML的过程中触发一个个的事件并调用用户定义的回调函数来处理XML文件. 我们常会用到startElement(name, attrs)方法, 他在遇到XML开始标签时调用, name是标签的名字, attrs是标签的属性值字典.
在有了ContentHandler的对象之后, 会使用parser方法来解析xml文档. 下面是完整的sax.parse的参数说明:
- xml.sax.parse( xmlfile, contenthandler[, errorhandler])
- - # 参数说明:
- - # xmlfile - xml文件名
- - # contenthandler - 必须是一个ContentHandler的对象
- - # errorhandler - 如果指定该参数,errorhandler必须是一个SAX ErrorHandler对象
解析探测器结果的例子
下面看一个简单的例子, 如何来解析探测器的结果. 我们的目标是计算出每一个车道(lane)的平均车速.
- import numpy as np
- from xml.sax import parse, handler
首先我们继承ContentHandler, 这个用来处理xml文档.
- class DetectorParse(handler.ContentHandler):
- """解析探测器的输出结果
- """
- def __init__(self):
- self.lanes = {}
- def startElement(self, name, attrs):
- if name == 'interval':
- det_id = attrs['id'] # 探测器ID
- lane_id = det_id[6:] # 对应的lane的ID
- if lane_id not in self.lanes:
- self.lanes[lane_id] = {}
- self.lanes[lane_id]['Speed'] = []
- if float(attrs['end']) < 100000000:
- self.lanes[lane_id]['Speed'].append(
- float(attrs['meanSpeed'])
- )
- def endDocument(self):
- """读取完整个xml文件后会触发
- """
- print(self.lanes)
接着开始处理, 最后处理的数据会放在detector_output这个实例里面.
- detector_output = DetectorParse()
- parse('./e2output.xml', detector_output)
他的 lanes 的数据大致如下所示, 相当于我们获得了一个车道不同时间段的速度:
- 'edge4_0_0': {'Speed': [7.07, 5.51, 4.18, 4.78, 8.2, 10.71, 3.85, 1.86, 2.51, 1.81, 3.94, 1.36, 0.23, 1.41, 1.36, 0.46, 0.13, 1.29, 0.11, 0.47, 0.85, 0.72, 2.97, 2.54, 1.56, 11.8, -1.0, -1.0, -1.0, -1.0, -1.0, -1.0, -1.0, -1.0, -1.0, -1.0, -1.0, -1.0, -1.0, -1.0, -1.0, -1.0, -1.0, -1.0, -1.0, -1.0, -1.0, -1.0, -1.0, -1.0, -1.0, -1.0, -1.0, -1.0, -1.0, -1.0, -1.0, -1.0, -1.0, -1.0, -1.0, -1.0, -1.0, -1.0, -1.0, -1.0, -1.0, -1.0, -1.0, -1.0, -1.0, -1.0, -1.0, -1.0, -1.0, -1.0, -1.0, -1.0, -1.0, -1.0, -1.0, -1.0, -1.0, -1.0, -1.0, -1.0, -1.0, -1.0, -1.0, -1.0, -1.0, -1.0, -1.0, -1.0, -1.0, -1.0, -1.0, -1.0, -1.0, -1.0, -1.0, -1.0, -1.0, -1.0, -1.0, -1.0, -1.0, -1.0, -1.0, -1.0, -1.0, -1.0, -1.0, -1.0, -1.0, -1.0, -1.0, -1.0, -1.0, -1.0, -1.0, -1.0, -1.0, -1.0, -1.0, -1.0, -1.0, -1.0, -1.0, -1.0, -1.0, -1.0, -1.0, -1.0, -1.0, -1.0, -1.0, -1.0, -1.0, -1.0, -1.0, -1.0, -1.0, -1.0, -1.0, -1.0, -1.0, -1.0, -1.0, -1.0, -1.0, -1.0, -1.0, -1.0, -1.0, -1.0, -1.0, -1.0, -1.0, -1.0, -1.0, -1.0, -1.0, -1.0, -1.0, -1.0, -1.0]}
这样我们就可以很方便的求出每一个车道的平均速度了.
- for key, value in detector_output.lanes.items():
- print(key, np.mean(value['Speed']))
最后输出如下:
- edge11_2_0 -1.0
- edge11_2_1 -1.0
- edge16_0_0 -1.0
- edge16_0_1 -1.0
- edge4_0_0 -0.3552095808383234
- edge4_0_1 -0.6406586826347305
- edge9_3_0 -1.0
- edge9_3_1 -1.0
- 微信公众号
- 关注微信公众号
-

- QQ群
- 我们的QQ群号
-


评论