文章目录(Table of Contents)
简介
在使用matplotlib绘制散点图的时候, 如果有不同的类别, 我们需要使用不同的颜色对类别进行标注, 同时需要有图例(legend)来说明每一种颜色和类别的对应.
但是直接使用plt.scatter把所有类别的点画在一起是不能标注的, 我们需要对每一类分别进行绘制.
参考资料
主要想法来源: matplotlib scatter plot with color label and legend specified by c option
简单实验
下面来看一个简单的实验, 说明如何进行绘制.
- import numpy as np
- from matplotlib import pyplot as plt
为了方便展示, 我们使用少量数据进行展示.
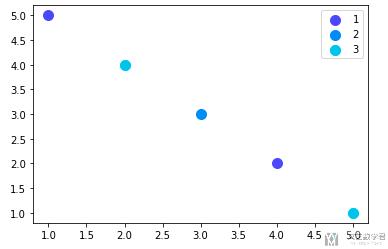
- scatter_x = np.array([1,2,3,4,5])
- scatter_y = np.array([5,4,3,2,1])
- group = np.array([1,3,2,1,3])
- cdict = {1: 'red', 2: 'blue', 3: 'green'}
最后绘制的时候, 每一个类别单独进行绘制, 同时可以指定需要的label是什么
- fig, ax = plt.subplots()
- for g in np.unique(group):
- ix = np.where(group == g)
- ax.scatter(scatter_x[ix], scatter_y[ix], c = cdict[g], label = g, s = 100)
- ax.legend()
- plt.show()
除了上面使用np.unique进行提取所有label的种类之外, 因为我们有index和label的对应关系, 即cdict, 我们可以直接使用这个. 注意看下面的for循环.
- for key in cdict.keys():
- ix = np.where(group == key)
- ax.scatter(scatter_x[ix], scatter_y[ix], c = cdict[key], label = key, s = 100)
关于散点图的颜色
到这里还有一个问题, 就是控制点的颜色. 上面我们的sdict里面存储的就是颜色, 所以可以在指定颜色的时候直接使用, 但是大部分时候里面不是颜色, 这个时候就需要使用将number和转换为颜色的功能.
- cmap = plt.get_cmap('rainbow', 12) # 数字与颜色的转换
上面的cmap里面输入一个数字, 可以将数字转换为RGB颜色. 下面是一个整体的代码, 注意其中color的指定的方式.
- cmap = plt.get_cmap('rainbow', 12) # 数字与颜色的转换
- scatter_x = np.array([1,2,3,4,5])
- scatter_y = np.array([5,4,3,2,1])
- group = np.array([1,3,2,1,3])
- cdict = {1: '111', 2: '222', 3: '333'}
- fig, ax = plt.subplots()
- for key in cdict.keys():
- ix = np.where(group == key)
- ax.scatter(scatter_x[ix], scatter_y[ix], color = cmap(key), label = key, s = 100) # 注意这里color的指定
- ax.legend()
- plt.show()
最终的结果如下所示:

- 微信公众号
- 关注微信公众号
-

- QQ群
- 我们的QQ群号
-


评论