文章目录(Table of Contents)
简介
这一篇文章主要介绍如何绘制轮廓线和对轮廓进行填充. 其实就是主要介绍contourf函数的简单使用方式. 主要会分为三个方面进行说明, 首先是函数中参数levels的作用, 接着是如何自定义使用的颜色和最后如何加上Legend.
参考链接: How do you create a legend for a contour plot in matplotlib?
contourf函数的官方文档: matplotlib.pyplot.contourf
绘图
levels的作用
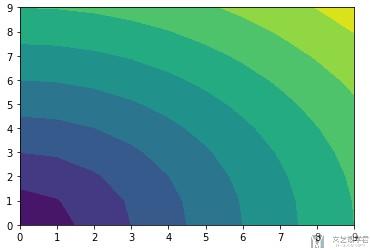
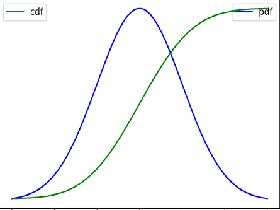
首先是参数设置中levels的作用. 当他输入时整数的时候, 如levels=3, 他会将数值分成三份, 设置为10就是分为10份, 可以看下面的例子.
- import numpy as np
- import matplotlib.pyplot as plt
- x, y = np.meshgrid(np.arange(10),np.arange(10))
- z = np.sqrt(x**2 + y**2)
- cs = plt.contourf(x,y,z,levels=10)
- plt.show()
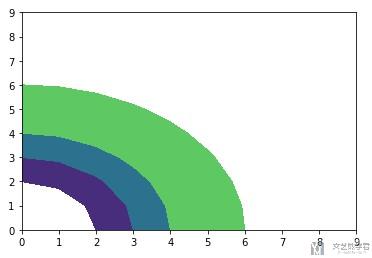
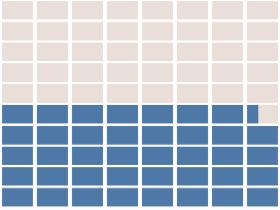
当然levels后面也是可以跟lists, 注意lists中的数字必须从小到大. 这个数字表示的是a0-a1是一部分, a1-a2是一部分. 比如levels=[2,3,4,6], 就表示2<x<3, 3<x<4, 4<x<5, 5<x<6, 最终的结果如下图所示.
- import numpy as np
- import matplotlib.pyplot as plt
- x, y = np.meshgrid(np.arange(10),np.arange(10))
- z = np.sqrt(x**2 + y**2)
- cs = plt.contourf(x,y,z,levels=[2,3,4,6])
- plt.show()
自定义颜色
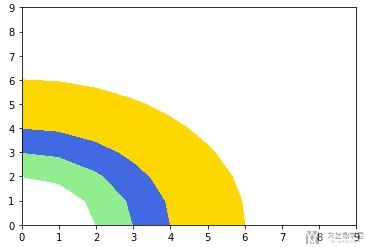
自定义颜色需要配合levels来进行使用, 比如我们指定了levels对应着三个范围, 我们就可以对这三个范围依次设置颜色, 如下所示.
- x, y = np.meshgrid(np.arange(10),np.arange(10))
- z = np.sqrt(x**2 + y**2)
- cs = plt.contourf(x,y,z,levels=[2,3,4,6], colors=['lightgreen', 'royalblue', 'gold'])
- plt.show()
最终的结果如下所示:
添加Legend
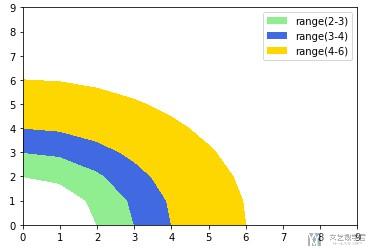
最后就是在contourf中添加Legend, 这个我也是从上面的参考链接里看到的, 可以直接进行使用.
- x, y = np.meshgrid(np.arange(10),np.arange(10))
- z = np.sqrt(x**2 + y**2)
- cs = plt.contourf(x,y,z,levels=[2,3,4,6], colors=['lightgreen', 'royalblue', 'gold'])
- # -----------
- # 添加Legend
- # -----------
- proxy = [plt.Rectangle((0,0),1,1,fc = pc.get_facecolor()[0]) for pc in cs.collections]
- plt.legend(proxy, ["range(2-3)", "range(3-4)", "range(4-6)"])
- plt.show()
- 微信公众号
- 关注微信公众号
-

- QQ群
- 我们的QQ群号
-


评论