文章目录(Table of Contents)
简介
这一部分会介绍一下关于 LaTeX 来完成论文写作的一些方式。之前介绍过 LaTeX 的一些基本的使用方式,这里主要是介绍使用他来完成科学类文章的写作。主要参考资料是 GitHub 上一个仓库里的内容,链接会放在下面。
更多资料
- 主要参考链接 : Tips and Tricks for Writing Scientific Papers
- LaTeX的更多详细说明 : LaTeX指南信息
表格的绘制
在说绘制表格之前, 简单说明几个问题:
- hline:表示横线
- toprule:表示三线表的表头的横线(这个与后面两个三线表的都需要使用booktabs
- midrule:表示三线表中间的横线
- bottomrule:表示三线表最后的横线
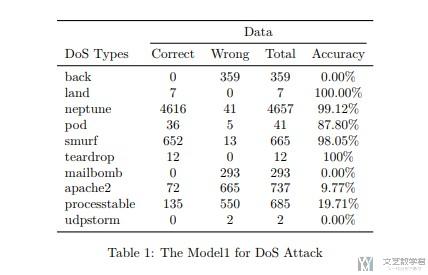
我们可以使用 booktabs 绘制出很漂亮的表格,下面看一个简单的例子。这个例子演示一下三线表的绘制, 这种表格在写 paper 的时候会经常被使用到.
- \documentclass{article}
- \usepackage{booktabs}
- \begin{document}
- % --
- \begin{table}
- \centering
- \begin{tabular}{lcccc}
- \toprule
- & \multicolumn{4}{c}{Data} \\ \cmidrule(lr){2-5}
- DoS Types & Correct & Wrong & Total & Accuracy \\
- \midrule
- back & 0 & 359 & 359 & 0.00\% \\
- land & 7 & 0 & 7 & 100.00\% \\
- neptune & 4616 & 41 & 4657 & 99.12\% \\
- pod & 36 & 5 & 41 & 87.80\% \\
- smurf & 652 & 13 & 665 & 98.05\% \\
- teardrop & 12 & 0 & 12 & 100\% \\
- mailbomb & 0 & 293 & 293 & 0.00\% \\
- apache2 & 72 & 665 & 737 & 9.77\% \\
- processtable & 135 & 550 & 685 & 19.71\% \\
- udpstorm & 0 & 2 & 2 & 0.00\% \\
- \bottomrule
- \end{tabular}
- \caption{The Model1 for DoS Attack}
- \label{tab-label}
- \end{table}
- \end{document}
简单做一下说明, 上面的我们需要修改的是 {lcccc} 这里后面四个 c 表示后面(也就是 Data 部分)的数据居中表示, multicolumn{4} 表示的是 Data 有 4 列。最终绘制的表格如下所示:
基础三线表
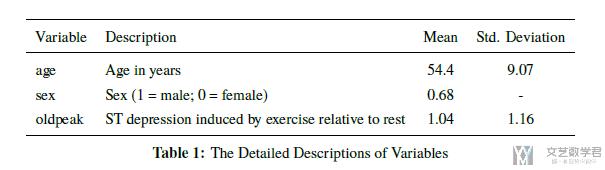
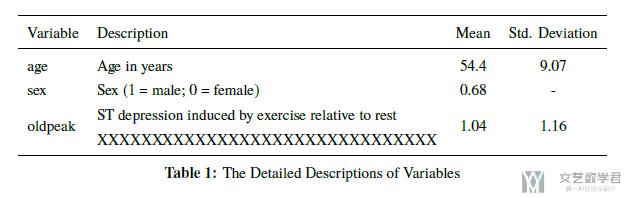
上面的三线表还是有点进阶的感觉, 我们这里来看一下最最基础的三线表的样子.
- \begin{table}
- \centering
- \begin{tabular}{llcc}
- \toprule % 顶部的那个横线
- Variable & Description & Mean & Std. Deviation \\
- \midrule % 中间那条线
- age & Age in years & 54.4 & 9.07 \\
- sex & Sex (1 = male; 0 = female) & 0.68 & - \\
- oldpeak & ST depression induced by exercise relative to rest & 1.04 & 1.16 \\
- \bottomrule % 最下面那条线
- \end{tabular}
- \caption{The Detailed Descriptions of Variables}
- \label{tab-label-1}
- \end{table}
最后绘制出的形状如下图所示:
表格行合并
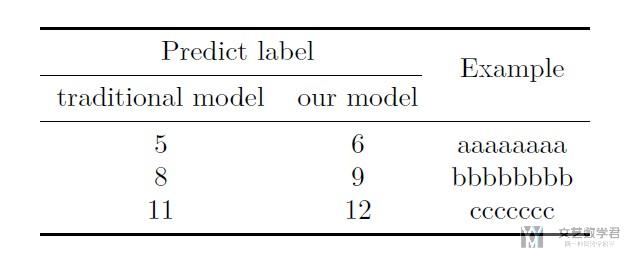
上面的表格我们讲了一下如何进行多列合并的操作, 下面我们来看一下如何进行多行的合并. 多行的合并使用 multirow 来完成相应的操作.
下面是对应的代码。在使用之前,我们需要引入相应的 package,及 multirow 这个 package。
- \usepackage{multirow}
接着就是对于表格的绘制, 简单的说明一下, 我们会把 \multirow 写在我们合并的起始行, 然后后面括号跟合并的行数, 后面的行空着就行.
- \begin{table}
- \centering
- \begin{tabular}{ccc}
- \toprule
- \multicolumn{2}{c}{Predict label} & \multirow{2}{*}{Example} \\ \cmidrule(r){1-2}
- traditional model & our model & \\
- \midrule
- 5 & 6 & aaaaaaaa \\
- 8 & 9 & bbbbbbbb \\
- 11 & 12 & ccccccc \\
- \bottomrule
- \end{tabular}
- \end{table}
参考资料: Combine and reduce rows in a table
多行多列合并的表格
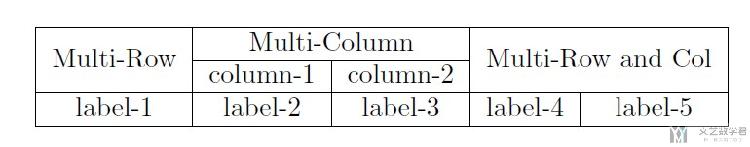
下面看一个稍微复杂一些的表格。里面同时有「多行合并」,也有「多列合并」。 同时包含多行和多列的合并。下面的内容来自这个链接: latex的table总结。我们直接来看代码:
- \begin{table}
- \centering
- \begin{tabular}{|c|c|c|c|c|}
- \hline
- \multirow{2}{*}{Multi-Row} & % 合并多行
- \multicolumn{2}{c|}{Multi-Column} & % 合并多列
- \multicolumn{2}{c|}{\multirow{2}{*}{Multi-Row and Col}} \\ % 同时合并多行和多列
- \cline{2-3} % 绘制2-3格的横线
- & column-1 & column-2 & \multicolumn{2}{c|}{} \\ % 这里的multicolumn为了画右侧的边框线
- \hline % 画一条横线
- label-1 & label-2 & label-3 & label-4 & label-5 \\
- \hline % 画一条横线
- \end{tabular}
- \end{table}
简单介绍一下上面表格中的参数. 主要注意一下下面hline和cline的使用.
- \multirow{2}{*}{Multi-Row}, \multirow是跨列功能,第一个参数2,表示跨两列,第二个参数*,表示系统自动调整文字,最后一个参数即是要填入的文字,跨列需注意的是,使用\multirow指令的那一列表格,到了要撰写下一列表格时,被跨列直接留空,不可填字(填了之后就会知道为什么了)
- \multicolumn{2}{c|}{Multi-Column}, \multicolumn是跨行功能,第一个参数2,表示跨两行,第二个参数c|,表示文字置中,并在栏位右边画一条直线框,最后一个参数即是要填入的文字
- \hline, 表示画出一整条从左至右横线
- \cline{2-3}, 表示画出一条在第2栏位到第3栏位的横线段,其他栏位将不会有横线段
下面是最终绘制出来的表格的结果.
表格中某个元素居中
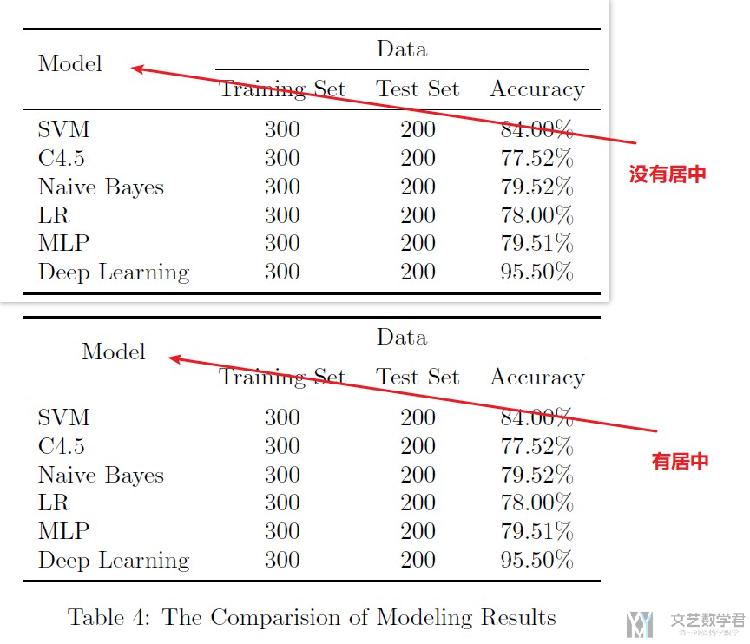
有的时候, 我们可能会有下面的需求, 我们表格中的某一列是左对齐的, 但是我们希望其中的header部分是居中的, 这个时候我们可以使用multicolumn来进行操作. 下面是一个简单的例子.
- % 没有居中的形式
- \begin{table}
- \centering
- \begin{tabular}{lccc}
- \toprule
- \multirow{2}{*}{Model} & \multicolumn{3}{c}{Data} \\ \cmidrule(lr){2-4}
- & Training Set & Test Set & Accuracy \\
- \midrule
- SVM & 300 & 200 & 84.00\% \\
- C4.5 & 300 & 200 & 77.52\% \\
- \bottomrule
- \end{tabular}
- \caption{The Comparision of Modeling Results}
- \label{tab-label-1}
- \end{table}
- % 居中的形式
- \begin{table}
- \centering
- \begin{tabular}{lccc}
- \toprule
- \multicolumn{1}{c}{\multirow{2}{*}{Model}} & \multicolumn{3}{c}{Data} \\ \cmidrule(lr){2-4} % 注意看这一行的第一个是怎么写的
- & Training Set & Test Set & Accuracy \\
- \midrule
- SVM & 300 & 200 & 84.00\% \\
- C4.5 & 300 & 200 & 77.52\% \\
- \bottomrule
- \end{tabular}
- \caption{The Comparision of Modeling Results}
- \label{tab-label-1}
- \end{table}
下面是有居中和没有居中的例子(代码里我省略了几行的内容, 不影响最后要说明的问题), 和两者的对比.
设置表格的宽度
有的时候我们需要让我们表格的宽度与文章某一栏的宽度是一样的,这个时候最简单的方法就是使用 resizebox 来调整表格的大小,如下所示:
- % 直接使用 resize 对 table 进行放缩
- \begin{table}[]
- \caption{}
- \label{tab:my-table}
- \resizebox{\columnwidth}{!}{%
- \begin{tabular}{cc}
- \hline
- \multirow{2}{*}{Network} & \multirow{2}{*}{Records} \\
- & \\ \hline
- 4-way & 1221 \\
- 3-way & 21 \\ \hline
- \end{tabular}%
- }
- \end{table}
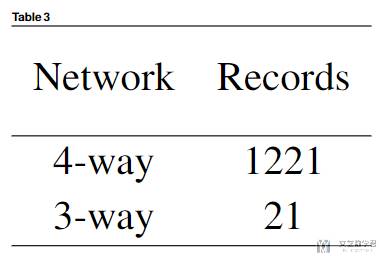
最终的效果如下图所示,可以看到虽然 resizebox 可以调整表格的宽度,但是同时也会改变字体的大小:
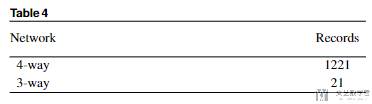
那有没有办法既不会使得字体大小改变,又可以让表格的宽度到指定的宽度呢。答案是有的,我们只需要在表格的列与列之间添加空白即可,使用 extracolsep 添加空白,如下所示:
- % 添加 whitespace 来达到适当的宽度
- \begin{table}[]
- \caption{}
- \label{tab:my-table}
- \begin{tabular*}{0.99\linewidth}{@{\extracolsep{\fill}}cc}
- \hline
- \multirow{2}{*}{Network} & \multirow{2}{*}{Records} \\
- & \\ \hline
- 4-way & 1221 \\
- 3-way & 21 \\ \hline
- \end{tabular*}%
- \end{table}
最终的效果如下所示,可以看到即改变了表格的宽度,也没有改变表格中字体的大小:
表格的手动换行与对齐
有的时候, 当有的表格单元格中的内容较多, 内容较长的时候, 我们可以选择手动进行换行, 虽然不是很优雅, 需要自己调整换行的位置, 但是也是一个很不错的方式.
在表格的单元格中, 我们需要借助makecell才能够完成换行. 我们下面看一个简单的例子.
- \begin{table}
- \centering
- \begin{tabular}{llcc}
- \toprule % 顶部的那个横线
- Variable & Description & Mean & Std. Deviation \\
- \midrule % 中间那条线
- age & Age in years & 54.4 & 9.07 \\
- sex & Sex (1 = male; 0 = female) & 0.68 & - \\
- oldpeak & \makecell{ST depression induced by exercise relative to rest \\ XXXXXXXXXXXXXXXXXXXXXXXXXXXXXXX} & 1.04 & 1.16 \\
- \bottomrule % 最下面那条线
- \end{tabular}
- \caption{The Detailed Descriptions of Variables}
- \label{tab-label-1}
- \end{table}
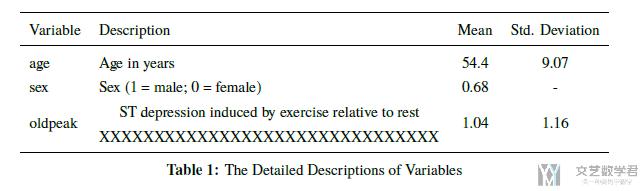
可以看到最后一行的第二列(descriptions)部分是进行了换行的.
参考资料: How to add a forced line break inside a table cell
但是, 此时我们有发现了一个问题, 这个时候那个cell是居中的, 我们希望他可以左对齐, 与其他的cell是一样的, 这个时候只需要加上makecell[l]{...}即可. 我们看一下下面的这个例子. 这里代码基本是和上面的是一样的, 就是加了一个l.
- \begin{table}
- \centering
- \begin{tabular}{llcc}
- \toprule % 顶部的那个横线
- Variable & Description & Mean & Std. Deviation \\
- \midrule % 中间那条线
- age & Age in years & 54.4 & 9.07 \\
- sex & Sex (1 = male; 0 = female) & 0.68 & - \\
- oldpeak & \makecell[l]{ST depression induced by exercise relative to rest \\ XXXXXXXXXXXXXXXXXXXXXXXXXXXXXXX} & 1.04 & 1.16 \\
- \bottomrule % 最下面那条线
- \end{tabular}
- \caption{The Detailed Descriptions of Variables}
- \label{tab-label-1}
- \end{table}
我们看一下最后编译之后的效果, 这样会比一开始的要整齐一些:
参考资料: How to left align text in a table with \makecell
表格的自动换行
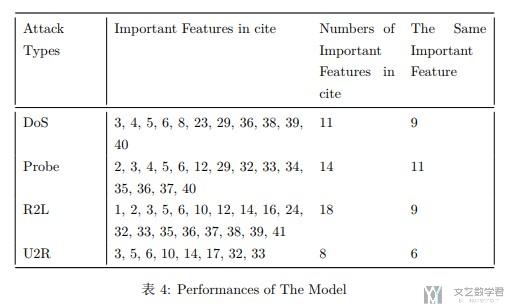
有的时候, 我们需要表格中的内容可以自动换行, 这里需要注意的是, Only the p - type can have a width argument. 关于自动换行的参考资料见: How to create a table with fixed column widths
我们看一个简单的例子:
- \begin{table}[htbp!]
- % 我提取的特征与其他人提取的特征
- \centering
- \begin{tabular}{|p{2cm}|p{5cm}p{2cm}p{2cm}|}
- \toprule
- Attack Types & Important Features in cite & Numbers of Important Features in cite & The Same Important Feature \\
- \midrule
- DoS & 3, 4, 5, 6, 8, 23, 29, 36, 38, 39, 40 & 11 & 9 \\
- Probe & 2, 3, 4, 5, 6, 12, 29, 32, 33, 34, 35, 36, 37, 40 & 14 & 11 \\
- R2L & 1, 2, 3, 5, 6, 10, 12, 14, 16, 24, 32, 33, 35, 36, 37, 38, 39, 41 & 18 & 9 \\
- U2R & 3, 5, 6, 10, 14, 17, 32, 33 & 8 & 6 \\
- \bottomrule
- \end{tabular}
- \caption{Performances of The Model}
- \label{tab5-ModelExplain-1}
- \end{table}
最终的效果如下图所示:
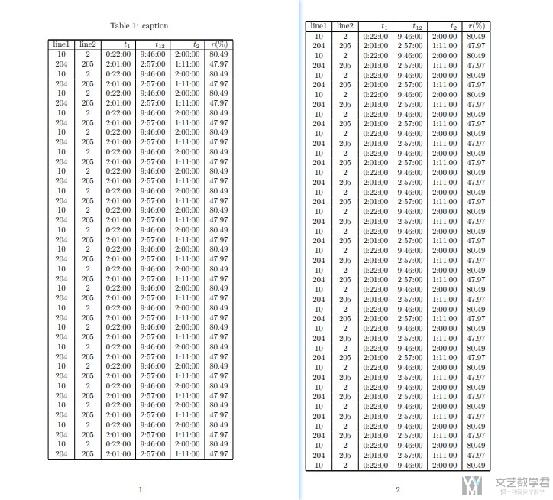
长表格自动换页
有的时候,我们会遇到表格过长,一页装不下的问题,这个时候就需要使用长表格的自动换页。同时,我们在自动换页的时候,希望表头和表尾的横线可以在每一页都出现。下面就看一个小例子,可以实现上面的功能,即长表格的自动换页和表头的自动重复。代码如下:
- \documentclass{article}
- \usepackage{longtable}
- \begin{document}
- \begin{longtable}{|c|c|r|r|r|r|}
- \caption{caption}
- \label{table:label} \\ % add \\ command to tell LaTeX to start a new line
- % Appear table header at the first page as well
- \hline
- line1 & line2 & $t_1$ & $t_{12}$ & $t_2$ & $r$(\%)\\
- \hline
- \endfirsthead
- % Appear the table header at the top of every page
- \hline
- line1 & line2 & $t_1$ & $t_{12}$ & $t_2$ & $r$(\%)\\
- \hline
- \endhead
- % Appear \hline at the bottom of every page
- \hline
- \endfoot
- % data begins here
- 10 & 2 & 0:22:00 & 9:46:00 & 2:00:00 & 80.49 \\
- 204 & 205 & 2:01:00 & 2:57:00 & 1:11:00 & 47.97 \\
- % 这里复制粘贴更多的数据, 使其可以超出一页的范围
- \hline
- \end{longtable}
- \end{document}
效果如下图所示, 虽然有些不清楚, 不过总之是可以实现分页的. 关于这个有几个点是需要主要的:
- 这里 longtable 外面不能再嵌套其他的table,否则不能实现分页;
- 注意在 label 后面需要有双斜杠(看一下上买的注释);
- 请查看上面代码的注释, 为了实现换页之后还有表头, 我们需要在前面加不一样的内容.
长表实现指定宽度
我们使用 longtable 的时候是无法使用 resizebox 来调整表格宽度的。为了调整表格宽度,我们可以使用 p 标签来进行指定。例如下面的例子:
- \begin{longtable}{|p{.05\textwidth}|p{.05\textwidth}|p{.05\textwidth}|}
- \end{longtable}
但是直接使用 p 标签,表格的内容是无法居中的。如果我们想要使得表格内容可以居中,我们需要自己定义一个样式,后面使用自己的样式即可(将 p 改为大写的 P 即可):
- \newcolumntype{P}[1]{>{\centering\arraybackslash}p{#1}}
- \begin{longtable}{|P{.05\textwidth}|P{.05\textwidth}|P{.05\textwidth}|}
- \end{longtable}
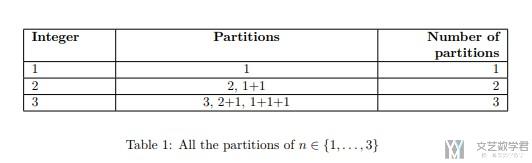
表格种内容的对齐
参考资料: How can I left-justify a paragraph cell in a table?
我们需要使用 array 的宏包:
- \usepackage{array}
接着可以使用raggedright, raggedleft, centering来完成左对齐, 右对齐和居中. 我们可以看一下下面的这个例子.
- \begin{table}
- \begin{center}
- \label{pntable}
- \begin{tabular}{|p{2cm}<{\raggedright}|>{\centering}p{6.5cm}|p{3cm}<{\raggedleft}|}
- \hline
- \textbf{Integer} & \textbf{Partitions} & \textbf{Number of partitions} \\ \hline
- 1 & 1 & 1 \\ \hline
- 2 & 2, 1+1 & 2 \\ \hline
- 3 & 3, 2+1, 1+1+1 & 3 \\ \hline
- \end{tabular}
- \end{center}
- \caption{All the partitions of $n \in \{1,\ldots,3\}$}
- \end{table}
最终的结果如下图所示:
绘制 cmidrule 长度为1
我们有的时候, 绘制三线表的时候, 需要上面cmidrule的宽度是一, 但是直接写\cmidrule(lr){1}是不行的, 我们需要写成\cmidrule(lr){1-1}. 下面我们看一个例子.
- % 三线表cmidrule长度为1
- \begin{table}
- \caption{Test}
- \label{tab4-Summary-1}
- \setlength{\tabcolsep}{3pt}
- \centering
- \begin{tabular}{lllllll}
- \toprule % 表格顶部的线
- \textbf{AAA} & \multicolumn{5}{c}{\textbf{BBB}} & \textbf{CCC} \\ \cmidrule(lr){1-1}\cmidrule(lr){2-6}\cmidrule(lr){7-7}
- \centering
- No. 1-3 & No. 1-14 & No. 15-28 & No. 29-42 & No. 43-56 & No. 57-70 & No. 1-11 \\
- \midrule % 划线
- 1 & 2 & 3 & 4 & 5 & 6 & 7 \\
- 1 & 2 & 3 & 4 & 5 & 6 & 7 \\
- 1 & 2 & 3 & 4 & 5 & 6 & 7 \\
- 1 & 2 & 3 & 4 & 5 & 6 & 7 \\
- 1 & 2 & 3 & 4 & 5 & 6 & 7 \\
- \bottomrule % 表格底部的线
- \end{tabular}
- \end{table}
最终的效果如下所示:
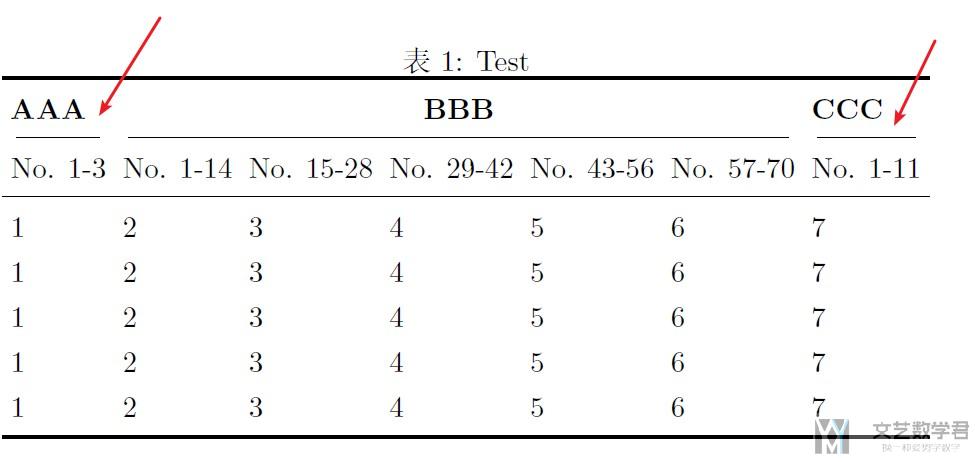
参考资料: \cmidrule one column wide
表格中内容加上 item (表格单元格内实现排序)
我们可以在表格中的内容加上类似于item的效果. 首先我们需要在最开始加上下面的内容.
- % 设置表格参数
- \newcommand{\tabitem}{~~\llap{\textbullet}~~}
- \usepackage{booktabs}
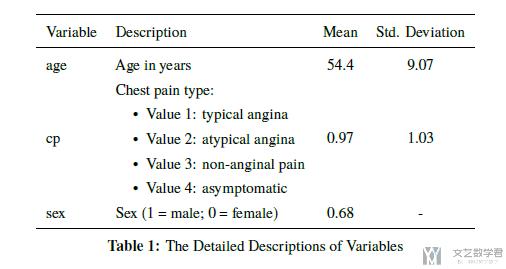
我们可以对上面的内容进行简单的修改, 从而控制item之后缩进的大小. 比如下面的例子, 我们使得其缩进的更多一些, 这样看起来可以整齐一些.
当然, 下面表格的内容, 我们用到了上面提到的cell内换行和对齐的技巧.
- \newcommand{\tabitem}{~~~~~~\llap{\textbullet}~~} % 关于表格中序号
- \begin{table}
- \centering
- \begin{tabular}{llcc}
- \toprule % 顶部的那个横线
- Variable & Description & Mean & Std. Deviation \\
- \midrule % 中间那条线
- age & Age in years & 54.4 & 9.07 \\
- cp & \makecell[l]{Chest pain type: \\
- \tabitem Value 1: typical angina \\
- \tabitem Value 2: atypical angina \\
- \tabitem Value 3: non-anginal pain \\
- \tabitem Value 4: asymptomatic} & 0.97 & 1.03 \\
- sex & Sex (1 = male; 0 = female) & 0.68 & - \\
- \bottomrule % 最下面那条线
- \end{tabular}
- \caption{The Detailed Descriptions of Variables}
- \label{tab-label-1}
- \end{table}
下面是最终的显示效果.
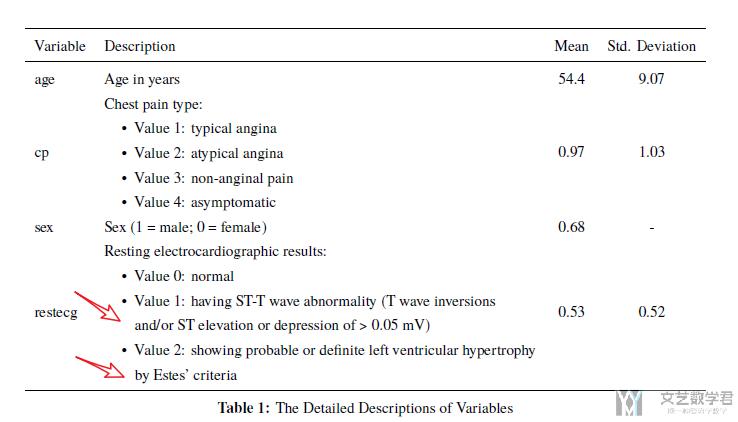
我们再来看一下更加麻烦的问题, 就是如果 item 中的内容过长, 还需要换行, 暂时我没有想到什么太好的方法, 只能再换行之后再手动加上空格, 就像下面这样.
- \begin{table}
- \centering
- \begin{tabular}{llcc}
- \toprule % 顶部的那个横线
- Variable & Description & Mean & Std. Deviation \\
- \midrule % 中间那条线
- age & Age in years & 54.4 & 9.07 \\
- cp & \makecell[l]{Chest pain type: \\
- \tabitem Value 1: typical angina \\
- \tabitem Value 2: atypical angina \\
- \tabitem Value 3: non-anginal pain \\
- \tabitem Value 4: asymptomatic} & 0.97 & 1.03 \\
- sex & Sex (1 = male; 0 = female) & 0.68 & - \\
- restecg & \makecell[l]{Resting electrocardiographic results: \\
- \tabitem Value 0: normal \\
- \tabitem Value 1: having ST-T wave abnormality (T wave inversions \\ ~~~~~~\llap~~ and/or ST elevation or depression of > 0.05 mV) \\
- \tabitem Value 2: showing probable or definite left ventricular hypertrophy \\ ~~~~~~\llap~~ by Estes' criteria} & 0.53 & 0.52 \\
- \bottomrule % 最下面那条线
- \end{tabular}
- \caption{The Detailed Descriptions of Variables}
- \label{tab-label-1}
- \end{table}
我们来看一下最终的效果, 这里注意我们红色箭头指的位置, 那里换行之后是有缩进的.
下面我们再来看一个完整的例子, 我们还可以用item来达到不一样的表格的效果.
- \documentclass{article}
- \usepackage[utf8]{inputenc}
- \usepackage{graphicx}
- \usepackage{ctex}
- \usepackage{geometry} % 设置页边距
- \geometry{a4paper,scale=0.8}
- % 设置表格参数
- \newcommand{\tabitem}{~~\llap{\textbullet}~~}
- \usepackage{booktabs}
- % 开始绘制表格
- \begin{document}
- \begin{table}
- \caption{Test}
- \label{tab4-Summary-1}
- \setlength{\tabcolsep}{3pt}
- \centering
- \begin{tabular}{lllllll}
- \toprule % 表格顶部的线
- \textbf{AAA} & \multicolumn{5}{c}{\textbf{BBB}} & \textbf{CCC} \\ \cmidrule(lr){1-1}\cmidrule(lr){2-6}\cmidrule(lr){7-7}
- \centering
- No. 1-3 & No. 1-14 & No. 15-28 & No. 29-42 & No. 43-56 & No. 57-70 & No. 1-11 \\
- \midrule % 划线
- \tabitem 1 & \tabitem 1 & \tabitem 2 & \tabitem 3 & \tabitem 4 & \tabitem 5 & \tabitem 6 \\
- \tabitem 2 & \tabitem 1 & \tabitem 2 & \tabitem 3 & \tabitem 4 & \tabitem 5 & \tabitem 6 \\
- \tabitem 3 & \tabitem 1 & \tabitem 2 & \tabitem 3 & \tabitem 4 & \tabitem 5 & \tabitem 6 \\
- & \tabitem 1 & \tabitem 2 & \tabitem 3 & \tabitem 4 & \tabitem 5 & \tabitem 6 \\
- & \tabitem 1 & \tabitem 2 & \tabitem 3 & \tabitem 4 & \tabitem 5 & \tabitem 6 \\
- & \tabitem 1 & \tabitem 2 & \tabitem 3 & \tabitem 4 & \tabitem 5 & \\
- & \tabitem 1 & \tabitem 2 & \tabitem 3 & \tabitem 4 & \tabitem 5 & \\
- \bottomrule % 表格底部的线
- \end{tabular}
- \end{table}
- \end{document}
最终的效果如下所示:
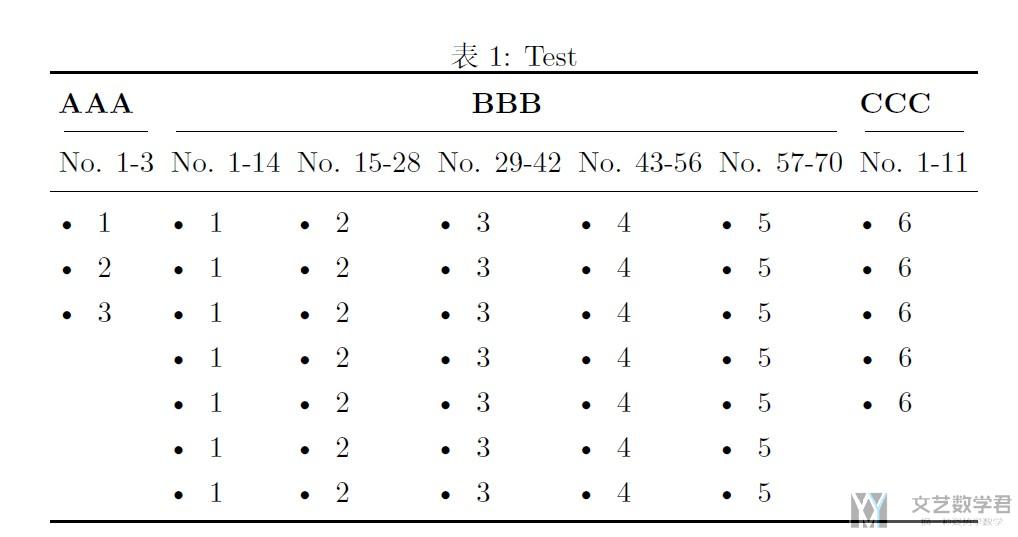
参考资料: How to use itemize in Table environment
文章作者信息
我们有的时候需要作者信息像下面这个样子.

首先是一个作者可以对应多个机构 (这个参考Adding more than one author with different affiliation)
- \usepackage{authblk}
- \author[1]{Author A\thanks{A.A@university.edu}}
- \author[1]{Author B\thanks{B.B@university.edu}}
- \author[1]{Author C\thanks{C.C@university.edu}}
- \author[1,2]{Author D\thanks{D.D@university.edu}}
- \author[2]{Author E\thanks{E.E@university.edu}}
- \affil[1]{Department of Computer Science, \LaTeX\ University}
- \affil[2]{Department of Mechanical Engineering, \LaTeX\ University}
- \renewcommand\Authands{ and }
除了上面的信息之外, 我们还需要添加邮件的信息, 这一部分参考Custom positions of author names, affiliations and emails in LaTeX article
下面的写法可以使得邮件是两行的.
- \affil[ ]{\textit{e-mail: wangmaonan@bupt.edu.cn, zkf\_bupt@163.com, luodan@bupt.edu.cn,}}
- \affil[ ]{\textit{qing0991@163.com, xjwang@bjut.edu.cn}}
LaTeX 绘制子图
利用 subfloat 来绘制子图
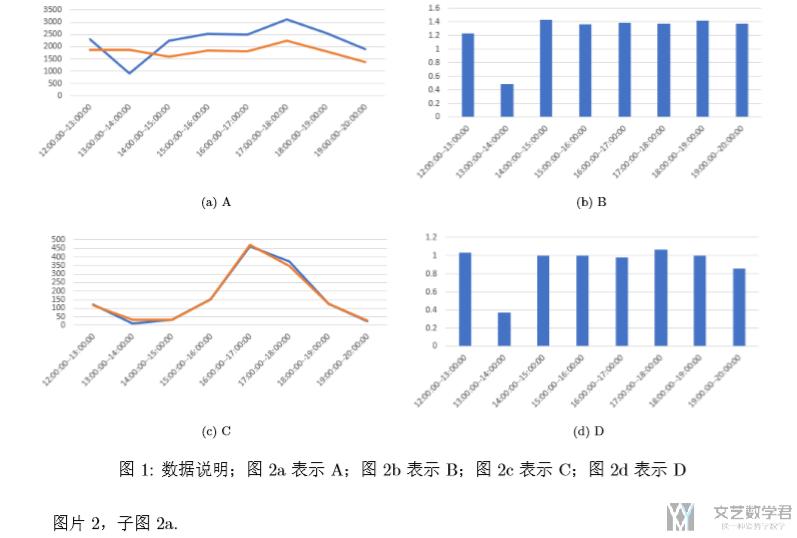
我们利用 subfig 包结合 subfloat 来创建子图。我们看一下下面的例子,将图片放置为 2*2 的子图。同时说明一下如何写图片标题以及引用图片。
- \documentclass{article}
- \usepackage{subfig} % 子图
- \begin{document}
- \begin{figure}[htbp!]
- \centering
- \subfloat[A]{
- \includegraphics[width=0.47\textwidth]{image/ldct/straight.png}
- \label{fig:ldct_straight}
- }
- \subfloat[B]{
- \includegraphics[width=0.47\textwidth]{image/ldct/straight_ratio.png}
- \label{fig:ldct_straight_ratio}
- }
- \quad
- \subfloat[C]{
- \includegraphics[width=0.47\textwidth]{image/ldct/right.png}
- \label{fig:ldct_right}
- }
- \subfloat[D]{
- \includegraphics[width=0.47\textwidth]{image/ldct/right_ratio.png}
- \label{fig:ldct_right_ratio}
- }
- \caption{数据说明;
- 图~\ref{fig:ldct_straight} 表示 A;
- 图~\ref{fig:ldct_straight_ratio} 表示 B;
- 图~\ref{fig:ldct_right} 表示 C;
- 图~\ref{fig:ldct_right_ratio} 表示 D}
- \label{ldct}
- \end{figure}
- % 引用
- 图片 \ref{ldct},子图 \ref{fig:ldct_straight}.
- \end{document}
最终的效果如下所示,包含子图和如何进行引用。
将 subfloat 中的 caption 居中
如果我们想要使得 subfloat 中的 caption 居中,只需要加上\captionsetup[subfloat]{justification=centering} 即可,下面是完整的一个例子:
- \begin{figure}[H]
- \centering
- \captionsetup[subfloat]{justification=centering} % 这个是重点
- \subfloat[A]{
- \includegraphics[width=0.47\textwidth]{Snipaste_2021-11-29_21-34-03.png}
- \label{fig:1}
- }
- \subfloat[B]{
- \includegraphics[width=0.47\textwidth]{Snipaste_2021-11-29_21-39-30.png}
- \label{fig:2}
- }
- \caption{测试 captionsetup}
- \end{figure}
使用 subfigure 绘制子图
接下来看一下如何使用 subfigure 来进行子图的创建。但是我们还是推荐使用上面的方式,也就是 subfig 和 subfloat 的方式来进行绘制。
- \documentclass{article}
- \usepackage{subfigure}
- \usepackage{graphicx}
- \usepackage{caption,setspace}
- \begin{document}
- \begin{figure*}[htbp!]
- \centering
- \subfigure[Explanation for DoS]{
- \includegraphics[width=4.16in]{DoSAttack.png} % 二分类模型的解释, DoS攻击的数据
- \label{fig5-Binary-1:1}
- }
- \quad %用 \quad 来换行
- \subfigure[Explanation for Normal]{
- \includegraphics[width=4.16in]{Normal.png} % 二分类模型的解释, Normal数据
- \label{fig5-Binary-1:2}
- }
- \caption{Specific Data Explanation}
- \label{fig5-Binary-1}
- \end{figure*}
- Fig.~\ref{fig5-Binary-1}
- Fig.~\ref{fig5-Binary-1:1}
- Fig.~\ref{fig5-Binary-1:2}
- \end{document}
最终的效果如下图所示, 我们可以对子图进行引用.
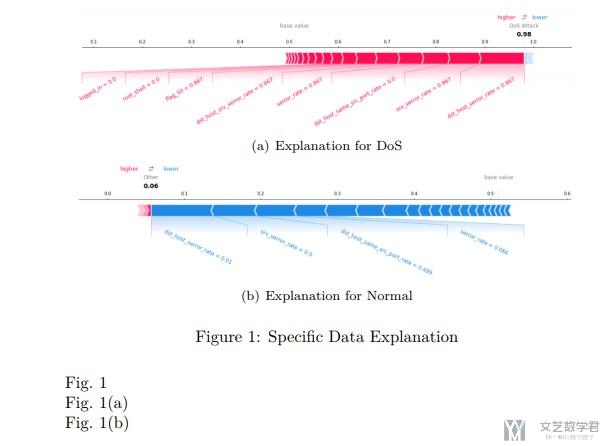
在这里需要注意一个问题, 我们一定要在label前面使用caption, 否则label是无法引用的. Always place the \label after (or within) the caption.
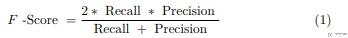
公式的书写
关于公式的书写,首先建议使用工具mathpix完成latex代码生成,工具链接将图像(数学公式)转换为LaTeX–Mathpix,进行粘贴即可。
注意公式书写需要package,amsmath. 下面看一个例子. 使用latex生成公式的时候是自动带上标号的,这个很是方便。
- \documentclass{article}
- \usepackage{amsmath}
- \begin{equation}
- F \text { -Score }=\frac{2 * \text { Recall } * \text { Precision }}{\text { Recall }+\text { Precision }}
- \end{equation}
最终效果如下所示:
一些常用的数学公式
这里介绍一些常用的latex的数学公式, 可以方便查找和进行使用. 可以参考链接: 常用数学符号的 LaTeX 表示方法
分式
- \frac{N}{M}

连加
- \sum_{i \in (1,100)}^{100}

上划线与下划线
其中\qquad表示空格
- \overline{\phi_{i}(f, x)} \qquad \underline{\phi_{i}(f, x)}

m行n列图片插入(子图插入)-子图
这一篇介绍一下关于LaTeX中子图的插入, 即我们希望插入n行m列的图片。主要参考链接如下: LaTeX中m行n列图片排版方法
我们使用subfigure包来完成排版。下面看一个简单的例子。下面会产生一个2*2的图片。
- \usepackage{subfigure}
- \begin{figure}[htbp!]
- \centering
- \subfigure[dst\_host\_serror\_rate Distribution]{
- \includegraphics[width=2in]{dataDistribution1.png}
- }
- \subfigure[srv\_serror\_rate Distribution]{
- \includegraphics[width=2in]{dataDistribution2.png}
- }
- \quad %用 \quad 来换行
- \subfigure[wrong\_fragment Distribution]{
- \includegraphics[width=2in]{dataDistribution3.png}
- }
- \subfigure[wrong\_fragment Distribution]{
- \includegraphics[width=2in]{dataDistribution3.png}
- }
- \caption{The disturbition of Data}
- \label{fig5-Distribution-1}
- \end{figure}
最终的效果如下所示:
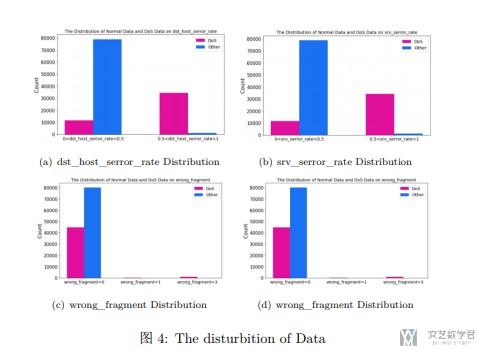
在这里需要注意一个问题, 我们一定要在label前面使用caption, 否则label是无法引用的. Always place the \label after (or within) the caption.
交叉引用
这里介绍关于LaTeX中交叉引用的实现. 主要参考链接(这一份参考资料很不错): 在 LaTeX 中使用交叉引用.
这里会包含引用章节, 引用图标, 引用数学公式等.
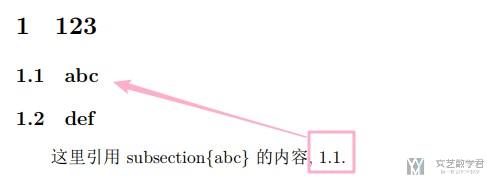
引用章节
下面简单说明一下引用章节的内容, 我们需要在section后面加上label, 来使得可以被引用.
- \documentclass{article}
- \usepackage[utf8]{inputenc}
- \usepackage{ctex} % 对于中文的显示
- \usepackage{booktabs}
- \begin{document}
- % 引用章节
- \section{123}
- \subsection{abc} \label{abc}
- \subsection{def}
- 这里引用subsection\{abc\}的内容, \ref{abc}.
- \end{document}
我们看一下最终的效果.
论文的引用
关于论文的引用, 在LaTeX指南信息中也做了简单的介绍, 在这里再做以下详细的说明.
我们需要将参考文献写在ref.bib文件中, 同时上面的bibliographystyle是可以有不同的选项的.
- % 参考文献
- \bibliographystyle{unsrt}
- \bibliography{ref} % 存文字的名字
下面简单介绍一下bibliographystyle的一些选项和不同的作用.
- plain,按字母的顺序排列,比较次序为作者、年度和标题
- unsrt,样式同plain,只是按照引用的先后排序
- alpha,用作者名首字母+年份后两位作标号,以字母顺序排序
- abbrv,类似plain,将月份全拼改为缩写,更显紧凑:
- ieeetr,国际电气电子工程师协会期刊样式:
- acm,美国计算机学会期刊样式:
- siam,美国工业和应用数学学会期刊样式:
- apalike,美国心理学学会期刊样式:
也就是我们要想使用按照引用的出现顺序进行标号, 我们就要使用unsrt的格式.
文献 cite, citet,citep 的区别
引用的时候有三种写法,分别是 cite,citet 和 citep。
- \begin{itemize}
- \item cite, \cite{liang2019deep}
- \item citet, \citet{liang2019deep}
- \item citep, \citep{liang2019deep}
- \end{itemize}
他们的效果分别如下所示:

引用多处文献
参考资料: latex中同一处引用多篇文献
正常情况我们编译以后的正文引用处显示的是[1][2][3], 但是我们希望文献显示为[1,2,3], 可以使用下面的方法进行实现.
- \usepackage{cite}
- \cite{bibtex1,bibtex2,bibtex3}
引用链接
有的时候, 我们引用的内容不是论文, 而是一些在线的内容, 这个时候我们可以使用下面的格式进行引用. 只需要在bib文件中按下面格式进行书写即可.
- @misc{workprocessNatter,
- author = {Elisabeth Natter},
- title = {{Effects of Globalization on Human Resources Management}},
- howpublished = "\url{https://smallbusiness.chron.com/effects-globalization-human-resources-management-61611.html}",
- year = {2018},
- note = "[Online; accessed 14-November-2018]"
- }
参考文献: How to add a URL to a LaTeX bibtex file?
参考文献加上页码
这里的内容我们在LaTeX的一些小技巧中首先进行了说明, 但是我感觉这个和引用有关系, 所以在这里也加上相同的内容.
有的时候, 我们在引用参考文献的时候, 需要加上页码. 我们可以使用\citep[p.~66]{参考文献}来进行引用.
- Project managers must allow time for the team to develop the common work practices using special tools that can facilitate this process \citep[p.~66]{schwalbe2008information}
最后的效果如下图所示.

我们也可以引用一段范围内的页码, 如下所示:
- Project managers must allow time for the team to develop the common work practices using special tools that can facilitate this process \citep[p.~66--80]{schwalbe2008information}.
最终的效果如下图所示:

参考文献: Referencing page number with only one reference
脚注及相关操作
这里的内容我们在LaTeX的一些小技巧中首先进行了说明, 但是我感觉这个和引用有关系, 所以在这里也加上相同的内容.
我们在这里对latex添加脚注进行相应的说明. 会分为三个部分:
- 最基础的脚注添加
- 脚注添加url
- 引用相同的内容
下面我们就从第一个开始说起. 对于最基础的脚注的添加. 这里加了label是为了后面引用的时候可以进行使用.
- This is a test of footnote\footnote{\label{note1}basic footnote test}.
最终的效果如下图所示:

接下来, 我们来看一下我们希望引用链接时候的情况.
- \usepackage{url}
- This is a test of footnote\footnote{\label{note1}\url{https://en.wikipedia.org/wiki/Uncertainty_avoidance}}.
最终的结果如下所示:

参考文献: latex, how to put superscript and link to URL downpage
我们再看最后的一种情况, 我们有一个相同的内容(例如链接), 要在文章的不同位置进行脚注. 如果直接按照上面的方式进行书写, 会出现两个相同的脚注. 所以我们需要使用下面的方式.
- \usepackage{url}
- % 引用脚注使用(在usepackage处进行使用)
- \makeatletter
- \newcommand\footnoteref[1]{\protected@xdef\@thefnmark{\ref{#1}}\@footnotemark}
- \makeatother
- This is a test of footnote\footnote{\label{note11}\url{https://en.wikipedia.org/wiki/Uncertainty_avoidance}}.
- This is another footnote\footnote{\label{note22}another one}.
- We have areference to first footnote\footnoteref{note11}.
- We have areference to second footnote\footnoteref{note22}.
最终的结果显示如下所示:

参考文献: Reference different places to the same footnote
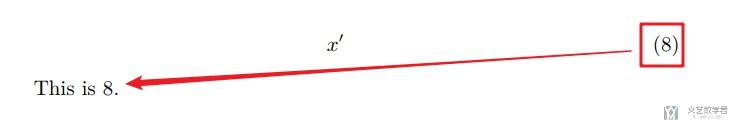
引用公式
这里我们来说一下公式的引用, 其实原理都是差不多的, 只需要定义一下label即可. 我们可以简单来看一下例子. 注意, 引用公式使用\eqref{eq}, 使用eqref会自动在数字外面加上括号, 下面就是没有括号的情况.
- \begin{equation} \label{part3_eq2}
- x^{\prime}
- \end{equation}
- % 上面定义了Label, 下面就可以引用
- This is \ref{part3_eq2}.
最终的结果如下图所示:
LaTeX手动换行
参考资料1: Allow line break, but without inserting a dash
参考资料2: Underscore makes text go past end of line into margins
我们使用\allowbreak或是\linebreak来进行分行, 同时使用这个时不会有连字符. 下面简单看两个例子.
- long\allowbreak word
- long\linebreak word
同时, 在latex中, 若出现了_的时候, 就不能自动换行. 我们可以使用下面的方式进行换行.
- \renewcommand\_{\textunderscore\allowbreak} % 使得_可以换行
- 微信公众号
- 关注微信公众号
-

- QQ群
- 我们的QQ群号
-


评论