今天我们介绍一下如何使用 Mathematica 来画出复平面的图像。(好吧,其实是正好整理文档的时候看到有这个文件,就想着顺便写一下)
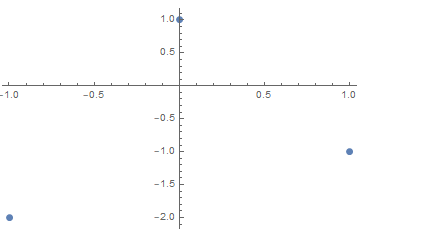
我们先来看一个简单的例子
- ListPlot[ReIm[{I, -1 - 2 I, 1 + -1 I}], PlotStyle -> PointSize[Large]]
画出的图像如下图所示,可以看到x轴是实轴,y轴是虚轴。如1 - 1*I就是表示坐标(1,-1)
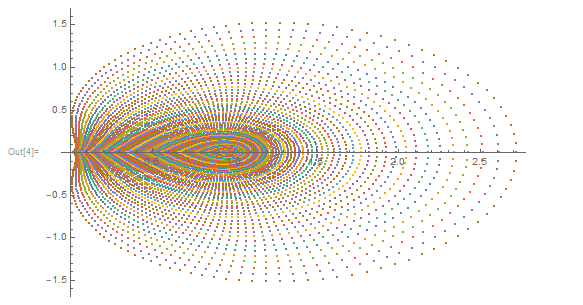
其实到这里差不多就写完了,但是其实我当时整理的文档里是这样两张图片:
- point = Table[ReIm[E^((x + I*y)^4)], {x, -1, 1, .01}, {y, -1, 1, .01}];
- ListPlot[point, PlotRange -> All]
- point = Table[ReIm[E^((x + I*y))], {x, -1, 1, .01}, {y, -1, 1, .01}];
- ListPlot@point
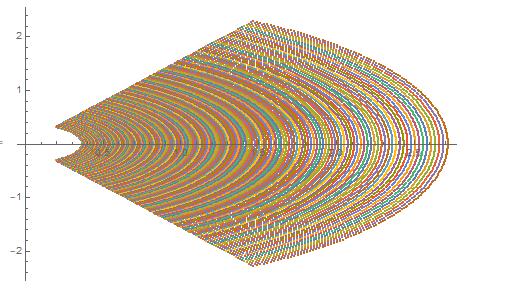
当时可能就是觉得好看就留下来了吧,(⊙ω⊙),其实我也想不去来了,那就把着两段代码写在这里吧。
- 微信公众号
- 关注微信公众号
-

- QQ群
- 我们的QQ群号
-


评论