文章目录(Table of Contents)
例题解析
为研究某一大都市报开设周日版的可行性,获得了34种报纸的平日和周日的发行量信息(以千为单位)。数据如下:
{Daily,Sunday}: {391.95, 488.51}, {516.98, 798.3}, {355.63, 235.08}, {238.55, 299.45}, {537.78, 559.09}, {733.78, 1133.25}, {198.83, 348.74}, {252.62, 417.78}, {206.2, 344.52}, {231.18, 323.08}, {449.76, 620.75}, {288.57, 423.3}, {185.74, 202.61}, {1164.39, 1531.53}, {444.58, 553.48}, {412.87, 685.97}, {272.28, 324.24}, {781.8, 983.24}, {1209.22, 1762.02}, {825.51, 960.31}, {223.75, 284.61}, {354.84, 407.76}, {515.52, 982.66}, {220.46, 557.}, {337.67, 440.92}, {197.12, 268.06}, {133.24, 262.05}, {374.01, 432.5}, {273.84, 338.36}, {570.36, 704.32}, {391.29, 585.68}, {201.86, 267.78}, {321.63, 408.34}, {838.9, 1165.57}
之前会有一个spss版本的应用回归分析之简单线性回归:https://mathpretty.com/8548.html, 大家可以先看spss版本的带有图形化界面的,再熟悉使用mathematica来操作。
下面开始讲如何使用mathematica来做简单的线性回归。
==1.计算协方差与相关系数==
- 将数据导入Mathematica
a = Import["D:\\作业一\\工作簿3.xlsx"]

a1 = a[[1]]
- 计算协方差
方法:
a2 = Table[{a1[[i]][[1]]}, {i, 1, Length[a1] - 2}]

a3 = Table[{a1[[i]][[2]]}, {i, 1, Length[a1] - 2}]

N[Covariance[a2, a3]]
结果:
{{97095.9}}
- 计算相关系数
方法:
N[Correlation[a2, a3]]
结果:
{{0.958154}}
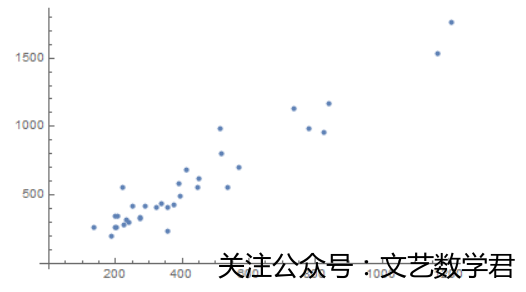
==2.构造散点图==
- 方法:
ListPlot[a1]
- 结果:

==3.拟合回归直线==
- 方法:
lm = LinearModelFit[a4, x, x]

Normal[lm]
- 结果:
13.834 + 1.33972 x
==4.计算回归直线参数的95%置信区间==
- 方法:
lm["ParameterConfidenceIntervals"]
- 结果:
{{-59.0972, 86.7651}, {1.1956, 1.48384}}
==5.当平日发行量为500000时,给出报纸周日发行量均值的95%置信区间==
- 方法:
(*计算残差*)

e = Sum[(a3[[i]] - 13.834 - 1.33972*a2[[i]])^2, {i, 1, Length[a1] - 2}]

sigma = (e/32)^(1/2)

mu = Mean[a2]

(*计算日发行量500千的时候周日发行量的预测*)

y0 = 13.834 + 1.33972*500

Needs["HypothesisTesting`"]

(*三个参数为均值,方差,自由度*)

StudentTCI[y0,sigma*(1 + 1/34 + (500 - mu)^2/(33*Variance[a2]))^(1/2), 32]
- 结果:
{{457.335}, {910.053}}
==6.某一正在考虑提供周日版的报纸,平日发行量为500000.给出该报纸周日发行量的95%预测区间==
- 方法:
Needs["HypothesisTesting`"]

(*三个参数为均值,方差,自由度*)

StudentTCI[y0, sigma*(1/34 + (500 - mu)^2/(33*Variance[a2]))^(1/2), 32]
- 结果:
{{644.196}, {723.192}}
- 微信公众号
- 关注微信公众号
-

- QQ群
- 我们的QQ群号
-


评论